Figures & data
Figure 1 The structure of (A) celastrol and (B) poly(ethylene glycol)-block-poly(ɛ-caprolactone) nanopolymeric micelles and (C) schematic illustration of celastrol-loaded micelle formation.
Abbreviation: PEG-b-PCL, poly(ethylene glycol)-block-poly(ɛ-caprolactone).
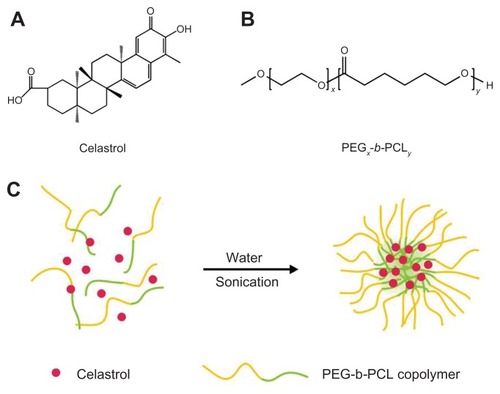
Figure 2 Average diameter of micelles before and after celastrol loading and transmission electron microscopy images of celastrol-loaded micelles. The particle size of nanopolymeric micelles was measured by dynamic light scattering. (A) Dynamic light scattering histogram reveals the size distribution of 48 nm celastrol polymeric micelles based on a poly(ethylene glycol)-block-poly(ɛ-caprolactone) copolymer (mean diameter: 36 nm). The celastrol nanoparticles were characterized using transmission electron microscopy. (B) Transmission electron microscopy image of the micelle sample after negative staining with 2% uranyl acetate solution shows their spherical shape.
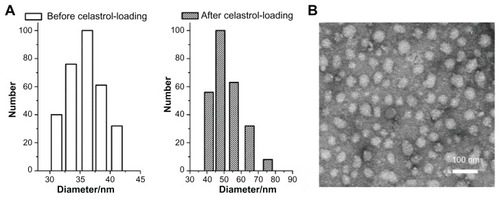
Figure 3 In vitro drug release profiles of celastrol from poly(ethylene glycol)-block-poly(ɛ-caprolactone) micelles (celastrol loading content: 7.36%) in phosphate buffered saline (pH 7.4) at 37°C. A typical two-phase release profile contained a burst release in the first stage followed by a sustained and slow release over a prolonged time of up to several weeks.
Note: The data are presented as mean ± standard deviation (n = 3).
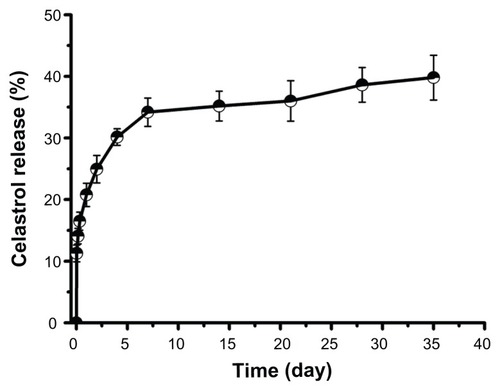
Figure 4 Celastrol nanoparticles dose-dependently inhibit the growth and capillary structure formation of human umbilical vein endothelial cells (EA.hy 926). (A) Morphological variations of EA.hy 926 cells treated with celastrol nanoparticles (0, 1.7, 3.4, 6.8, 13.6, or 27.2 μg/mL) for 72 hours. (B) EA.hy 926 cells treated with either celastrol nanoparticles or blank micelles (0, 1.7, 3.4, 6.8, 13.6, or 27.2 μg/mL) for 72 hours. Water-soluble tetrazolium salt assay was used to determine cell viability after exposure to the nanoparticles. The blank micelles without celastrol showed a cell viability of above 95%. Increasing the amount of celastrol nanoparticles increased the inhibition effect on the EA.hy 926 cells. (C) Celastrol nanoparticles inhibited the tube formation of endothelial cells in Matrigel™ (BD Biosciences, San Jose, CA). EA.hy 926 cells pretreated with or without celastrol nanoparticles were placed in a 96-well plate coated with Matrigel (5 × 10⁴ cells per well). After 10 hours, the tubular structure of the endothelial cells was photographed (magnification: ×200).
Notes: The data are presented as mean ± standard deviation for three independent experiments performed in triplicate. Statistical significance was based on the difference when compared with the control; *P < 0.01.
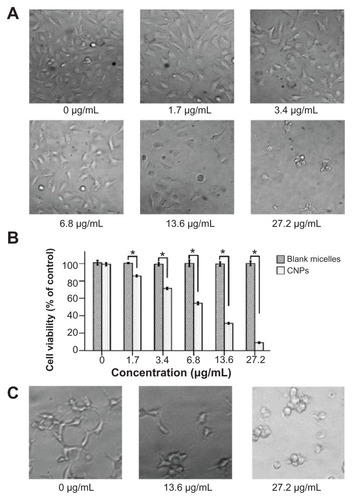
Figure 5 Inhibitory effects of celastrol nanoparticles on suture-induced corneal neovascularization in rats. Animals were sutured (two stitches) in the temporal cornea, and then treated with subconjunctival injection of celastrol nanoparticles (0.544 mg per rat) on day 0 and day 3 after surgery. Slit-lamp microphotographs of corneas were taken after mydriasis on day 6 after surgery. The pictures show (A) an intensive corneal neovascularization in response to suturing and (B) a marked inhibition of neovascularization by celastrol nanoparticles. The images were taken by perfusing the cornea with India ink on day 6 after suturing. Note the distinct suppression of corneal neovascularization by celastrol nanoparticles. (C) Abundant corneal neovascularization reached the sutures. (D) Shorter and fewer areas of corneal neovascularization were found in the celastrol-treated group. (E and F) show the inhibition effect of celastrol nanoparticles on the length and area of corneal neovascularization, respectively.
Notes: The length and area of corneal neovascularization were measured with Image-Pro® Plus 5.1 (Media Cybernetics Inc, Bethesda, MD) in triplicate for each cornea. The data are presented as mean ± standard deviation of five rats. *P < 0.001 versus the control group (magnification: ×25).
Abbreviations: CI, confidence interval; CNPs, celastrol nanoparticles.
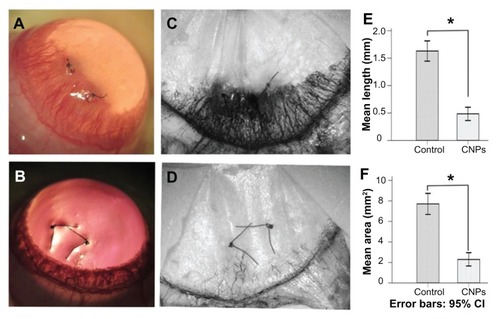
Figure 6 Celastrol nanoparticles inhibit neovascularization and macrophage infiltration in rat cornea. Rats were treated with celastrol nanoparticles (0.544 mg per rat) on day 0 and day 3 after surgery. Corneal tissue was fixed in 10% neutralized buffered formaldehyde, and 5 μm paraffin sections were stained with hematoxylin and eosin. (A) Celastrol nanoparticle-treated group showed significantly inhibited neovascularization and inflammatory cell infiltration in cornea on day 6 after surgery when compared with (B) the control group. Red arrows show new blood vessels. Corneal sections were processed by anti-rat CD68 staining in (C) celastrol nanoparticle-treated group and (D) the control group. Celastrol nanoparticles suppressed macrophage infiltration in the cornea on day 6 after surgery. The number of infiltrated macrophage (CD68+) cells in the corneal stroma was counted in five randomly selected fields (×400) of the immunofluorescence-stained slides.
Notes: The number of infiltrating macrophages was analyzed by IBM SPSS (v 16.0; SPSS Inc, Chicago, IL). The data are presented as mean ± standard deviation (magnification: ×100). Statistical significance is based on the difference when compared with the control; *P < 0.001.
Abbreviation: CI, confidence interval.
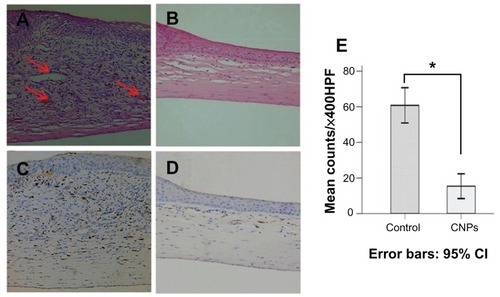
Figure 7 Celastrol nanoparticles inhibit the expression of angiogenic genes. Corneas were harvested on day 6 after surgery, followed by messenger ribonucleic acid expression analysis using real-time reverse transcription-polymerase chain reaction. Normal corneas were used as the control. Messenger ribonucleic acid expression of vascular endothelial growth factor, matrix metalloproteinase 9, and monocyte chemoattractant protein 1 in the normal corneas were arbitrarily set as 1.0. The y-axis shows the mean of the relative messenger ribonucleic acid expression of a certain gene compared to the normal cornea gene. Celastrol nanoparticles decreased the expression of (A) vascular endothelial growth factor, (B) matrix metalloproteinase 9, and (C) monocyte chemoattractant protein 1 messenger ribonucleic acid in the cornea on day 6 after surgery.
Notes: The data are presented as mean ± standard deviation. Statistical significance is based on the difference when compared with the control; *P < 0.001.
Abbreviations: CNPs, celastrol nanoparticles; MCP-1, monocyte chemoattractant protein 1; MMP-9, matrix metalloproteinase 9; VEGF, vascular endothelial growth factor.
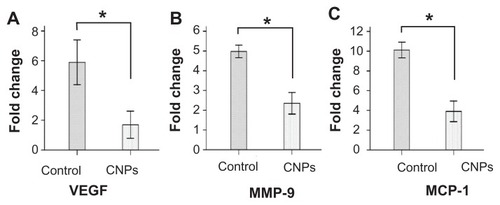
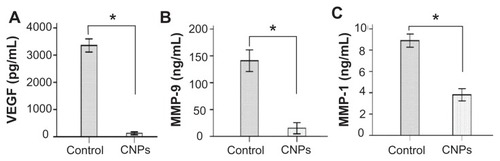
Figure 8 Celastrol nanoparticles inhibit the expression of angiogenic factor proteins in the cornea. Corneas were harvested on day 6 after surgery and the concentration of (A) vascular endothelial growth factor, (B) matrix metalloproteinase 9, and (C) monocyte chemoattractant protein 1 in the corneal tissue lysates were assessed by enzyme-linked immunosorbent assay.
Notes: The data are presented as mean ± standard deviation of three independent experiments. Statistical significance is based on the difference when compared with the control; *P < 0.001.
Abbreviations: CNPs, celastrol nanoparticles; MCP-1, monocyte chemoattractant protein 1; MMP-9, matrix metalloproteinase 9; VEGF, vascular endothelial growth factor.