Figures & data
Figure 1 Schematic of bacteria assays. Commercially available PVC ETTs were enzymatically degraded to create nanoscale surface roughness. Then, control PVC and NanoR ETTs were soaked into different concentrations of a fructose solution. Bacterial survival in the medium (assay 1) and biofilm formation on the ETT surfaces (assay 2) were quantified.
Abbreviations: ETT, endotracheal tube; NanoR, nanorough; PVC, polyvinyl chloride; TBS, tryptic soy broth.
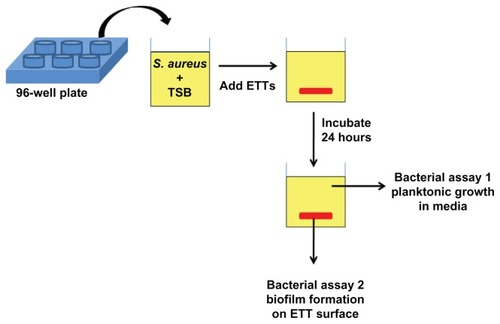
Table 1 RMS values of PVC and NanoR surfaces before and after soaking in two different concentrations (10 mM and 100 mM) of a fructose solution
Figure 2 SEM images of untreated PVC and NanoR PVC. Untreated PVC samples revealed a smooth surface (A, 10 KX; C, 30 KX; and E, 65 KX). On the other hand, NanoR PVC samples revealed a rough surface (B, 10 KX; D, 30 KX; and F, 65 KX).
Abbreviations: NanoR, nanorough; PVC, polyvinyl chloride; SEM, scanning electron microscope.
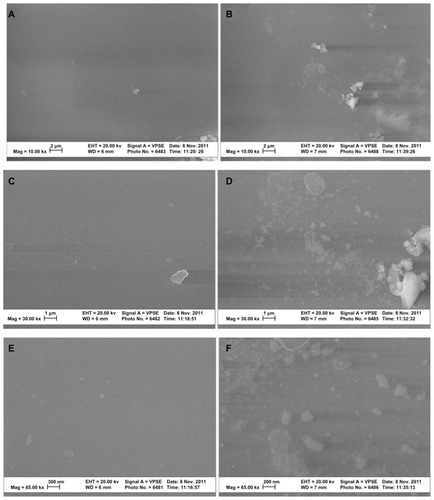
Figure 3 AFM micrographs showing the topography of (A and B) control PVC and NanoR PVC; (C and E) control PVC soaked in 10 mM and 100 mM fructose; and (D and F) NanoR PVC soaked in 10 mM and 100 mM fructose, respectively. Micrographs revealed distinct differences in nanotopographies between the control PVC and NanoR PVC surface soaked in different metabolite concentrations.
Abbreviations: AFM, atomic force microscopy; NanoR, nanorough; PVC, polyvinyl chloride.
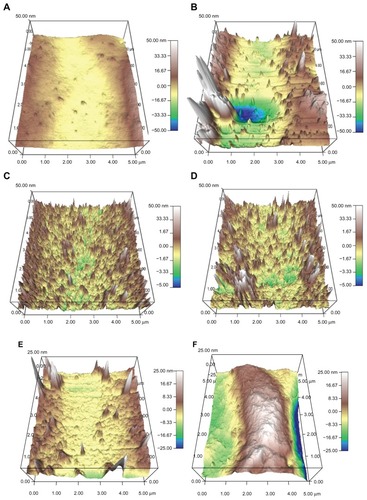
Table 2 Water contact angles on PVC and NanoR PVC surfaces before and after soaking into two different concentrations (10 mM and 100 mM) of a fructose solution
Figure 4 Staphylococcus aureus optical density measurements after 24 hours. Planktonic bacteria growth decreased on NanoR surfaces soaked in a fructose (10 mM and 100 mM) solution.
Notes: Data represent mean ± SEM, n = 3. *P < 0.05 NanoR compared to NanoR soaked in 100 mM fructose, NanoR soaked in 10 mM fructose compared to NanoR soaked in 100 mM fructose.
Abbreviations: NanoR, nanorough; OD, optical density; SEM, standard error of the mean.
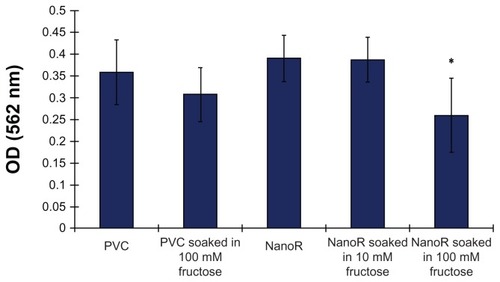
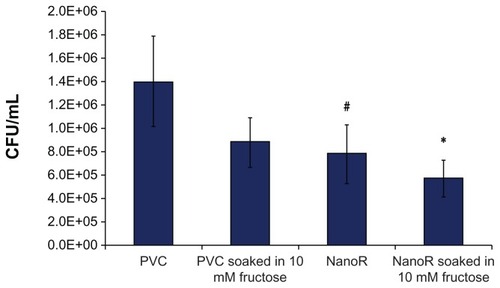
Figure 5 Staphylococcus aureus colony counts on PVC and NanoR surfaces soaked in a 10 mM fructose solution. Biofilm formation decreased on NanoR and PVC surfaces soaked in a 10 mM fructose solution after 24 hours.
Notes: Data represent mean ± SEM, n = 4. *P < 0.05 NanoR soaked in a 10 mM fructose solution compared to the PVC control, #P < 0.1 NanoR compared to the PVC control.
Abbreviations: CFU, colony forming units; NanoR, nanorough; PVC, polyvinyl chloride; SEM, standard error of the mean.