Figures & data
Figure 1 DOX concentrations per group in (A) mucosa, (B) detrusor and (C) serosa. ***p<0.001; **p<0.01; *p < 0.05; n.s.: not significant. Error bars represent standard error of mean.
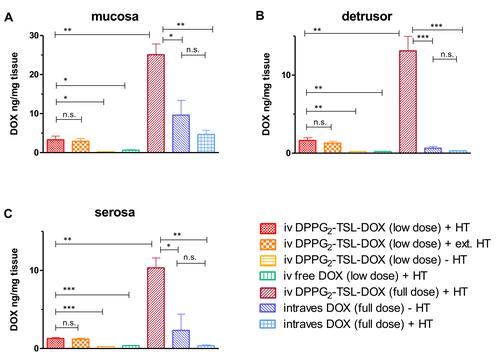
Figure 2 DOX concentrations per group in (A) heart, (B) kidney, (C) liver, (D) spleen and (E) lung. **p<0.01; *p < 0.05. Error bars represent standard error of mean.
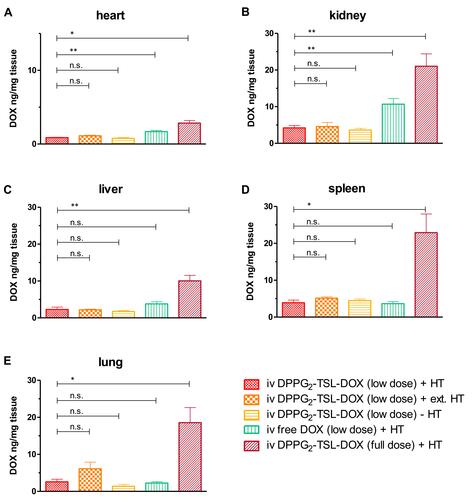
Table 1 DOX Concentrations per Group and Bladder Wall Layer
Figure 3 DOX concentrations of the HT groups at mucosa (dark filling), detrusor (light filling), and serosa (clear filling).
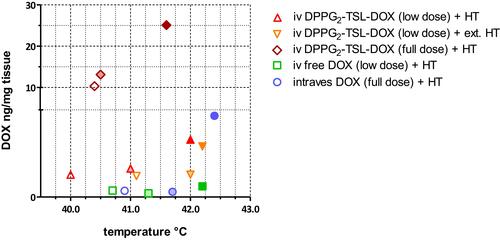
Table 2 DOX Concentrations per Group and Organ
Figure 4 DOX plasma concentrations per group. Error bars represent standard error of mean.
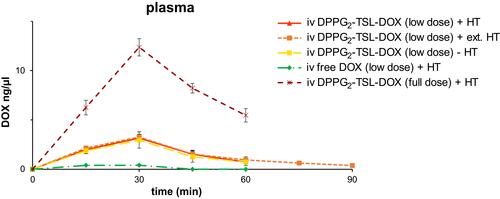
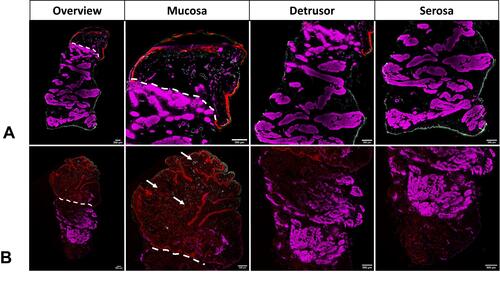
Figure 5 Fluorescence microscopy of the bladder of (A) intravesical doxorubicin (DOX) without hyperthermia (HT) (full dose); (B) intravenous DPPG2-thermosensitive liposomes containing DOX (DPPG2TSL-DOX) with HT (full dose). Red: DOX contained within the tissue; green: cytokeratin filaments of epithelial cells; white: Von-Willebrand-Factor (VWF) within blood vessel walls; and purple: actin filaments in smooth muscle fibres (SMA). White lines mark the transition from mucosa (above the line) to detrusor. The white arrows pointed at red dots show DOX accumulation around the small vessels after DPPG2-TSL-DOX with HT.