Figures & data
Figure 1 The process of polysaccharide of Pleurotus eryngii extraction and purification.
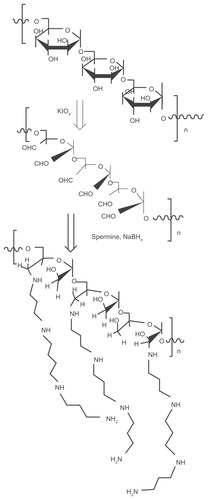
Figure 2 The process of spermine grafting to the polysaccharide (dextran is used as an example).
Notes: The reductive amination method is used to produce the cationized polysaccharide: the polysaccharide is first oxidized by KIO4; after the addition of spermine, NaBH4 is used to reduce the reactants.
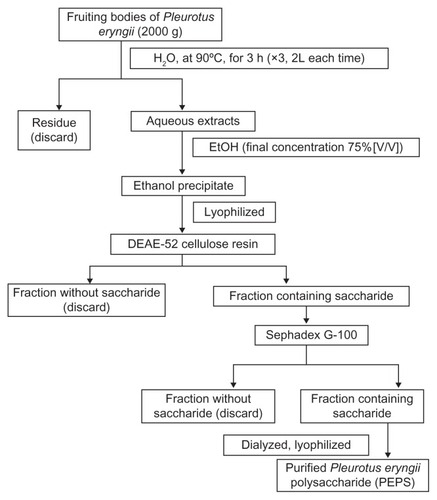
Figure 3 The process of cationized Pleurotus eryngii polysaccharide (CPEPS) preparation.
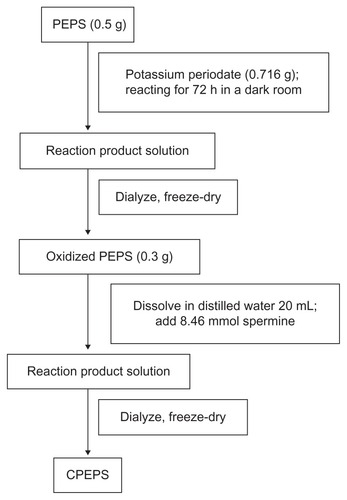
Table 1 Amino group content and cross-linking of CPEPS
Figure 4 Fourier transform infrared spectra of polysaccharide of Pleurotus eryngii (PEPS) and cationized P. eryngii polysaccharide (CPEPS).
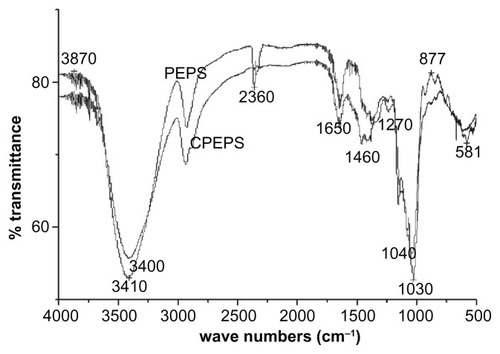
Figure 5 Agarose gel electrophoresis of the CPEPS-pTGF-β1 nanoparticles.
Notes: Well 1, free pTGF-β1; wells 2–7, CPEPS-pTGF-β1 nanoparticles with various weight ratios of CPEPS/pTGF-β1 (from left to right: 5:1, 10:1, 20:1, 30:1, 60:1, and 80:1).
Abbreviations: CPEPS, cationized Pleurotus eryngii polysaccharide; pTGF-β1, plasmid encoding transforming growth factor beta-1.
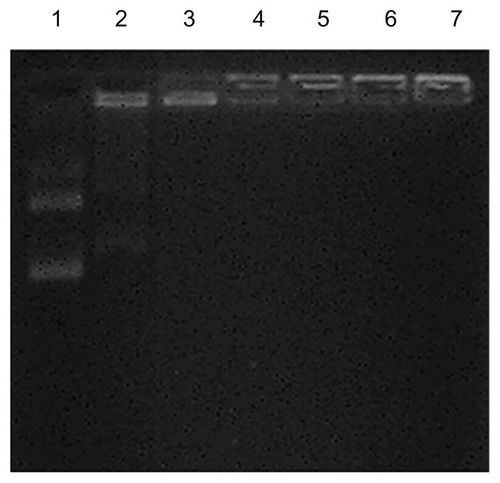
Figure 6 The zeta potentials of free pTGF-β1, CPEPS, and CPEPS combined with different amounts of pTGF-β1 to yield the following CPEPS/pTGF-β1 weight ratios: 10:1, 20:1, and 30:1.
Note: The values are the means ± standard error of the mean of three experiments.
Abbreviations: TGF-β1, transforming growth factor beta-1; pTGF-β1, plasmid encoding TGF-β1; CPEPS, cationized P. eryngii polysaccharide.
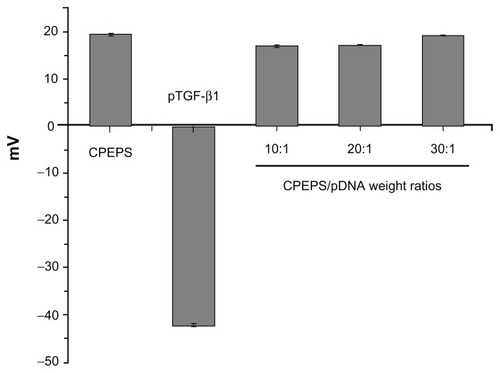
Table 2 The size distribution of nanoparticles with CPEPS/pTGF- β1 weight ratios of 10:1, 20:1, and 30:1
Figure 7 Particle size distribution and morphology. (A) The particle size distribution of the CPEPS/pTGF-β1 nanoparticles with a weight ratio of 20:1; (B) transmission electron microscopy image of the CPEPS/pTGF-β1 nanoparticles with a weight ratio of 20:1.
Abbreviations: CPEPS, cationized Pleurotus eryngii polysaccharide; pTGF-β1, plasmid encoding transforming growth factor beta-1.
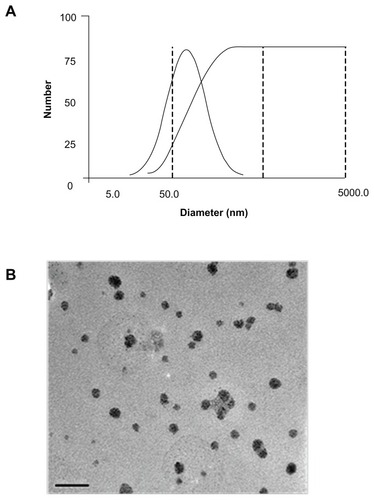
Figure 8 Cytotoxicity assay. From left to right: Lipofectamine™ 2000; polyethylenimine (25 kDa); free plasmid; CPEPS-pTGF-β1 nanoparticles with CPEPS/pTGF-β1 weight ratios of 10:1, 20:1, and 30:1.
Note: The values are the means ± standard error of the mean of three experiments.
Abbreviations: CPEPS, cationized Pleurotus eryngii polysaccharide; PEI, polyethylenimine; pTGF-β1, plasmid encoding transforming growth factor beta-1.
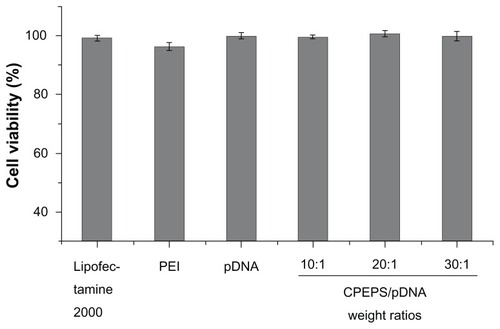
Figure 9 Transmission electron microscopy (TEM) images of MSCs before and after transfection. (A) TEM image of mesenchymal stem cells before transfection; (B–D) TEM images of mesenchymal stem cells after transfection by CPEPS-pTGF- β1 nanoparticles with CPEPS/pTGF-β1 weight ratios of 10:1, 20:1, and 30:1, respectively.
Abbreviations: CPEPS, cationized Pleurotus eryngii polysaccharide; pTGF-β1, plasmid encoding transforming growth factor beta-1.
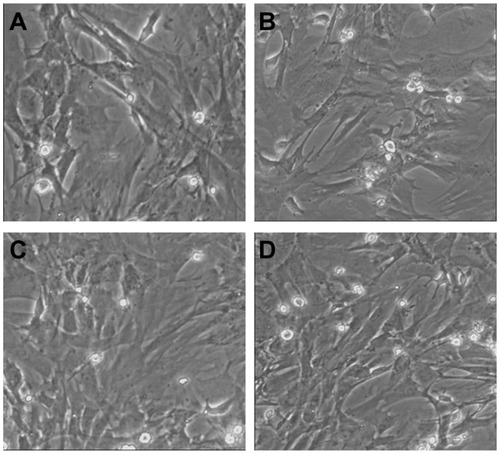
Figure 10 TGF-β1 protein released into the medium from mesenchymal stem cells 72 hours after treatment with CPEPS-pTGF-β1 nanoparticles. (A) TGF-β1 protein concentrations in the medium with various weight ratios of CPEPS to pTGF-β1: 10:1 (first bar), 20:1 (second bar), and 30:1 (third bar), as well as in free plasmid DNA (fourth bar). (B) A comparison of TGF-β1 expression levels: free plasmid DNA (first bar); Lipofectamine™ 2000 (second bar); polyethylenimine (25 kDa, third bar); and CPEPS-pTGF-β1 nanoparticles with a CPEPS/pTGF-β1 weight ratio of 20:1 (fourth bar).
Note: The values are the means ± standard error of the mean of three experiments.
Abbreviations: TGF-β1, transforming growth factor beta-1; pTGF-β1, plasmid encoding TGF-β1; CPEPS, cationized Pleurotus eryngii polysaccharide; PEI, polyethylenimine.
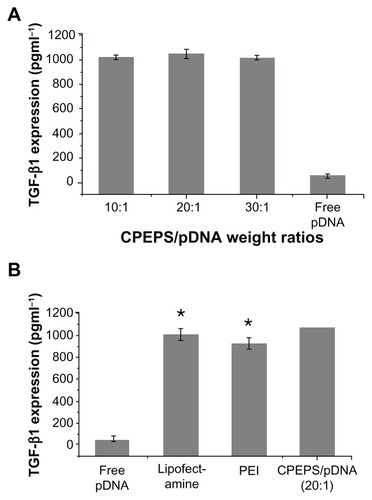
Figure 11 Messenger RNA expression of TGF-β1 in mesenchymal stem cells (MSCs).
Notes: Well 1, MSCs transfected with free pTGF-β1; well 2, MSCs transfected with Lipofectamine™ 2000/pTGF-β1; well 3, MSCs transfected with CPEPS-pTGF- β1 nanoparticles.
Abbreviations: TGF-β1, transforming growth factor beta-1; CPEPS, cationized Pleurotus eryngii polysaccharide; pTGF-β1, plasmid encoding TGF-β1; GAPDH, glyceraldehyde 3-phosphate dehydrogenase.
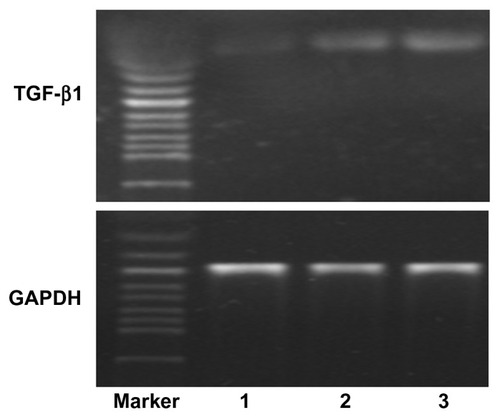
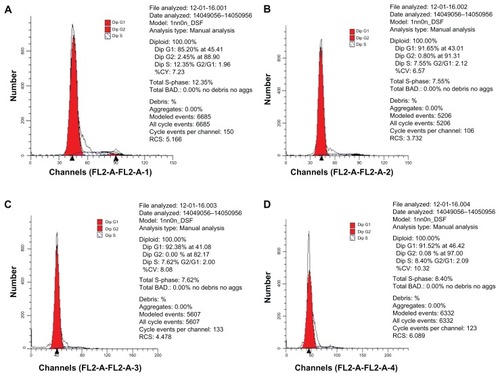
Figure 12 Flow cytometry of propidium iodide-stained mesenchymal stem cells (MSCs). (A) MSCs treated with plasmid TGF-β1; (B) MSCs treated with Lipofectamine™ 2000/pTGF-β1; (C) MSCs treated with CPEPS-pTGF-β1 nanoparticles; (D) MSCs treated with medium containing pTGF-β1 protein.
Abbreviations: TGF-β1, transforming growth factor beta-1; pTGF-β1, plasmid encoding TGF-β1; CPEPS, cationized Pleurotus eryngii polysaccharide.