Figures & data
Figure 1 Carotid collar model is clearly visible in bright field anatomic image.
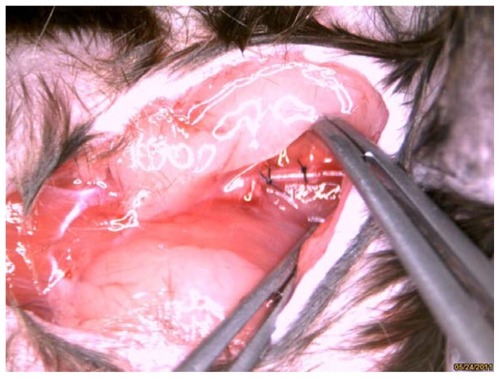
Figure 2 Identification of neointima formation in apoE−/− mouse using in vivo MRI and the corresponding histology. (A) Example of MR images at day 10 following perivascular collar placement. MRI of a mouse with slight stenosis of the left carotid artery. The image shows an in vivo image of a transverse section at the RCA and LCA after perivascular collar placement using MSME proton-density/T2-weighted sequences. (B) Example of MR images at day 21 following perivascular collar placement. MRI of a mouse with significant stenosis of the left carotid artery. LCA with a neointima formation reveals a stenostic lumen, white arrows indicate aortic stenosis. (C) Corresponding H&E stain obtained in a mouse at 21 days following perivascular collar placement. Representative photomicrographs showing hematoxylin and eosin stained cross sections of proximal carotid site (H&E staining, 20×). (D) Representative carotid artery tree image in mice acquired at 7 T using 3D-FLASH sequence. The longitudinal view shows the characteristic stenosis of the left carotid artery.
Abbreviations: H&E, hematoxylin-and-eosin; LCA, left carotid artery; MR, magnetic resonance; MRI, magnetic resonance imaging; MSME, multi-spin multi-echo; RCA, right carotid artery.
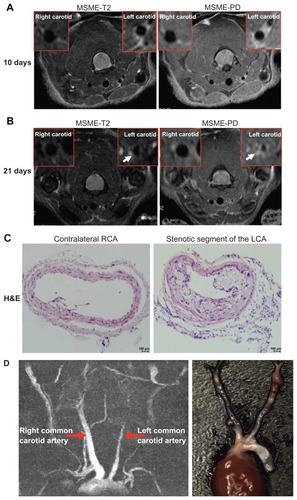
Figure 3 Ex vivo overview of whole carotid artery imaging fluorescence c(RGDyK)-Cy5.5 signal. Pseudo-color fluorescence images of stenotic carotid artery mice were acquired 24 hours following intravenous injection of c(RGDyK)-Cy5.5. (A) In situ whole carotid artery imaging fluorescence c(RGDyK)-Cy5.5 signal, red arrow shows the region of interest of the stenotic segment of the left carotid artery. (B) Ex vivo whole carotid artery imaging fluorescence c(RGDyK)-Cy5.5 signal in a control mouse, and a mouse with a stenotic segment of the left carotid artery. (C) Ex vivo whole carotid artery imaging fluorescence c(RGDyK)-Cy5.5 signal in a control mouse, and a mouse with a stenotic segment of the left carotid artery, along with a mouse with a stenotic segment of the left carotid artery coinjections of 1 nmol of c(RGDyK)-Cy5.5 and bicyclic RGD peptide H-Glu[cyclo(Arg-Gly-Asp-D-Tyr-Lys)]2 using the Maestro in vivo imaging system. Red arrows indicate signal intensity. (D) Injection of Cy5.5 dye alone showed nonspecific binding. The PE tube itself gave no signal.
Abbreviation: PE, pressure equalization.
![Figure 3 Ex vivo overview of whole carotid artery imaging fluorescence c(RGDyK)-Cy5.5 signal. Pseudo-color fluorescence images of stenotic carotid artery mice were acquired 24 hours following intravenous injection of c(RGDyK)-Cy5.5. (A) In situ whole carotid artery imaging fluorescence c(RGDyK)-Cy5.5 signal, red arrow shows the region of interest of the stenotic segment of the left carotid artery. (B) Ex vivo whole carotid artery imaging fluorescence c(RGDyK)-Cy5.5 signal in a control mouse, and a mouse with a stenotic segment of the left carotid artery. (C) Ex vivo whole carotid artery imaging fluorescence c(RGDyK)-Cy5.5 signal in a control mouse, and a mouse with a stenotic segment of the left carotid artery, along with a mouse with a stenotic segment of the left carotid artery coinjections of 1 nmol of c(RGDyK)-Cy5.5 and bicyclic RGD peptide H-Glu[cyclo(Arg-Gly-Asp-D-Tyr-Lys)]2 using the Maestro in vivo imaging system. Red arrows indicate signal intensity. (D) Injection of Cy5.5 dye alone showed nonspecific binding. The PE tube itself gave no signal.Abbreviation: PE, pressure equalization.](/cms/asset/b09462e2-5d38-47cc-853c-3be2b196f246/dijn_a_28065_f0003_c.jpg)
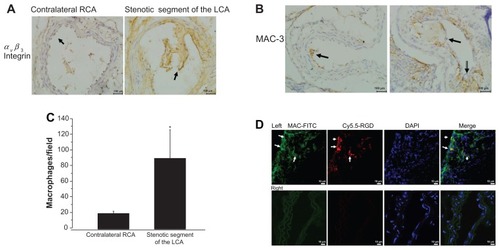
Figure 4 Accumulation of macrophages in the stenotic segment. (A) Representative micrograph of carotid artery sections stained with antibodies against αvβ3 integrin (400× magnification, scale bar = 100 μm). (B) Representative images of MAC-3 immunostaining in the stenotic lesion areas of the left carotid artery (400× magnification, scale bar = 100 μm). (C) Quantitative analyses of MAC-3-positive cells. (D) Colocalization in the proximal neointima, blue fluorescence of DAPI, the red fluorescence of Cy5.5 (probe) and the green fluorescence of FITC (macrophage) were examined (800× magnification).
Notes: Upper panel shows representative photomicrographs of cross sections of left carotid artery proximal carotid site, white arrows show positive staining. Lower panel shows representative photomicrographs of cross sections of right carotid artery.
Abbreviation: DAPI, diamidino-2-phenylindole dihydrochloride.