Figures & data
Figure 1 Description of histomorphometric analysis and parameters. Cross-sectional histological images were color converted to facilitate the discrimination of tissue types (from left to right images). To measure the bone area in the standardized vicinity levels from the implant surface, the tissue area was divided into two different zones: near (50 μm proximity) and far (50–200 μm) zones from the implant surface as segmented by white lines. The green lines represent the bone tissue in direct contact with the implant, while the yellow lines represent the bone tissue separated from the implant surface by soft tissue intervention. See the detailed description in the Materials and Methods section.
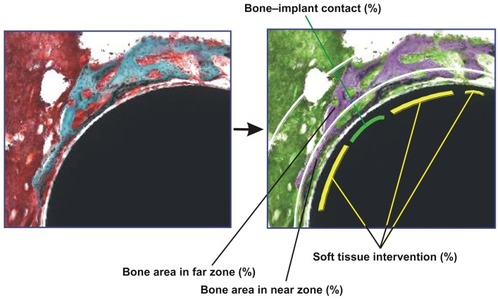
Figure 2 Creation of nanopolymorphic hydroxyapatite on microroughened titanium. Three different surfaces were prepared from Grade 5 titanium alloy (Ti-6Al-4V). (A) Low- and high-magnification scanning electron microscopic images of machined, sandblasted, and sandblasted + hydroxyapatite-coated surfaces. (B) Further close-up scanning electron microscopic images of the sandblasted + hydroxyapatite-coated surfaces showing nanopolymorphic features of nanoscale needle-like architectures in various diameters, lengths, and orientations.
Abbreviation: HA, hydroxyapatite.
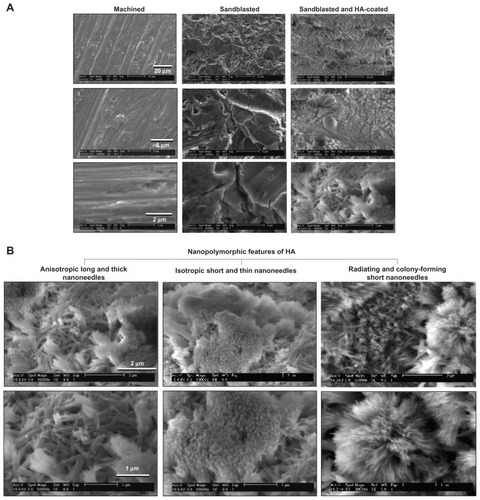
Figure 3 Quantitative measurement of surface roughness and surface area of the machined, sandblasted, and sandblasted + hydroxyapatite-coated surfaces using atomic force microscopy. Surface area was measured in a 5 μm × 5 μm horizontal plane. Atomic force microscopic three-dimensional images (5 μm × 5 μm) of sandblasted and sandblasted + hydroxyapatite-coated surfaces are also presented in a vertical scale of 800 nm.
Notes: *P < 0.05; **P < 0.01; ***P < 0.001, indicating a statistically significant difference compared to the machined surface (n = 6).
Abbreviation: HA, hydroxyapatite.
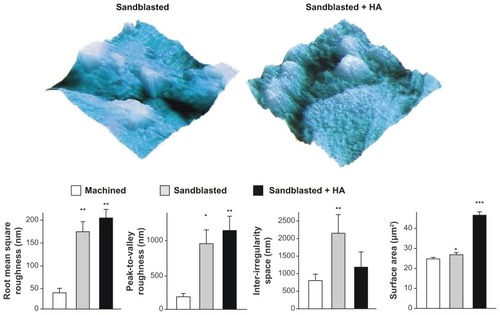
Figure 4 Surface chemistry and structural properties of sandblasted + hydroxyapatite-coated surfaces. (A) Surface chemistry spectra for machined, sandblasted, and sandblasted + hydroxyapatite-coated surfaces obtained from an energy dispersive X-ray spectroscopy. (B) A crystallographic pattern of sandblasted + hydroxyapatite-coated surfaces obtained by X-ray diffraction. The diffractogram shows the intensity peaks corresponding to those of hydroxyapatite. (C) Crystallinity assessment by X-ray diffraction. The degree of crystallinity was determined by hydroxyapatite/aluminum oxide X-ray diffraction intensity ratio (black dots), where the hydroxyapatite/aluminum oxide ratio of the fully crystallized hydroxyapatite (hydroxyapatite sintered at 1000°C) was used as 100% standard (black square).
Abbreviations: Al, aluminum; Al2O3, aluminum oxide; Ca, calcium; HA, hydroxyapatite; O, oxygen; P, phosphorus; Ti, titanium; V, vanadium.
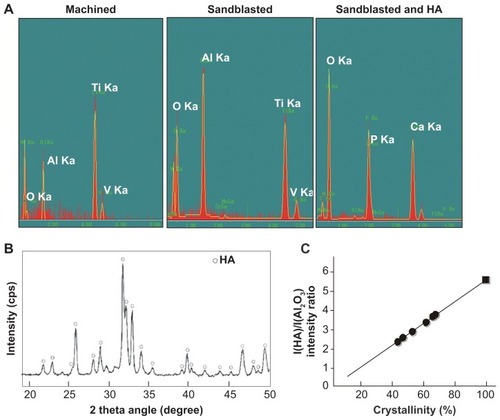
Figure 5 Microroughness-enhanced bone-titanium integration (implant anchorage in bone) evaluated by biomechanical push-in test. Push-in value of the machined and sandblasted implants at multiple healing times.
Notes: Data are shown as mean ± standard deviation (n = 6). *P < 0.05, indicating a statistically significant difference between the two surfaces.
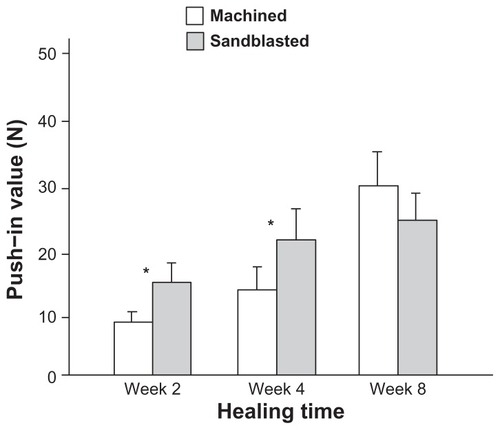
Figure 6 Nanopolymorphic crystalline hydroxyapatite-enhanced bone–titanium integration (implant anchorage in bone) evaluated by biomechanical push-in test. Push-in value of the sandblasted and sandblasted + hydroxyapatite-coated implants.
Notes: Data are shown as mean ± standard deviation (n = 6). *P < 0.05; **P < 0.01, indicating a statistically significant difference between the two surfaces.
Abbreviation: HA, hydroxyapatite.
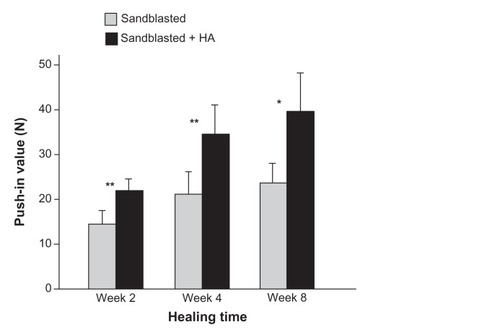
Figure 7 Morphological and elemental analyses of the sandblasted and sandblasted + hydroxyapatite-coated implant interfaces at early healing stage of week two. The implants were retrieved after push-in test and the tissue interfaces were exposed and analyzed by scanning electron microscopy and energy dispersive X-ray. (A) Representative low-magnification scanning electron microscopic images of the retrieved implants. (B and C) High-magnification scanning electron microscopic images and energy dispersive X-ray spectra of the sandblasted surfaces for the areas indicated in (A). (D–F) High-magnification scanning electron microscopic images and energy dispersive X-ray spectrum of the sandblasted + hydroxyapatite-coated implant surfaces for the areas indicated in (A).
Abbreviations: Al, aluminum; Ca, calcium; HA, hydroxyapatite; P, phosphorus; Ti, titanium.
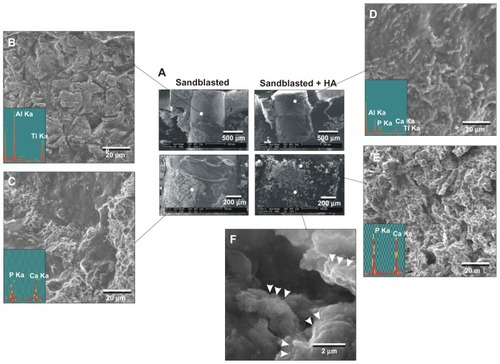
Figure 8 Morphological and elemental analyses of the sandblasted and sandblasted + hydroxyapatite-coated implant interfaces at late healing stage of week four by scanning electron microscopy and energy dispersive X-ray. (A) Representative low-magnification scanning electron microscopic images of the retrieved implants. (B–D) High-magnification scanning electron microscopic images and energy dispersive X-ray spectra of the sandblasted surfaces for the areas indicated in (A). (E and F) High-magnification scanning electron microscopic images and energy dispersive X-ray spectrum of the sandblasted + hydroxyapatite-coated implant surfaces for the areas indicated in (A).
Abbreviations: Al, aluminum; Ca, calcium; HA, hydroxyapatite; P, phosphorus; Ti, titanium.
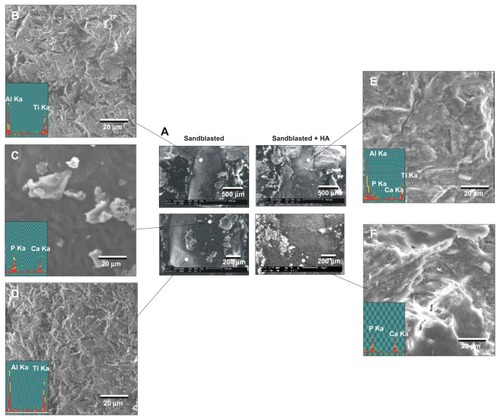
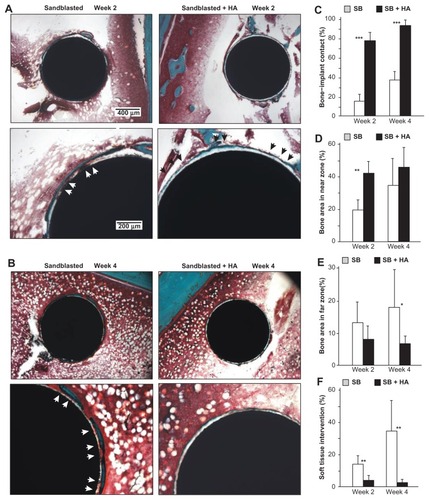
Figure 9 Nanopolymorphic crystalline hydroxyapatite-enhanced periimplant bone generation. (A and B) Representative histological images of the sandblasted and sandblasted + hydroxyapatite-coated implants with Goldner’s trichrome stain at weeks two and four postimplantation. Average histomorphometric values of (C) bone– implant contact, (D) bone area in near zone, (E) bone area in far zone, and (F) soft tissue intervention are shown (n = 6).
Notes: *P < 0.05; **P < 0.01; ***P < 0.001, indicating a statistically significant difference between the two surfaces.
Abbreviations: HA, hydroxyapatite; SB, sand blasted.