Figures & data
Figure 1 The representative scheme of loading multidrugs in MMSNs. The multidrug-loaded MMSNs were prepared by a sequential adsorption procedure, and induced synergistic cancer cell suppression. DOX adsorb on MMSNs via electrostatic attraction, while PTX and RAPA through hydrogen bond or polar interactions. The adsorption of drugs was affected by each other.
Abbreviations: DOX, doxorubicin; MMSNs, magnetic mesoporous silica nanoparticles; PTX, paclitaxel; RAPA, rapamycin.
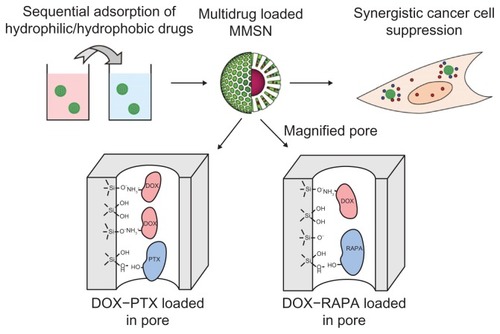
Figure 2 Characterization of the surfactant-free MMSN sample. (A) TEM image of MMSNs. (B) Nitrogen adsorption/desorption isotherm and the corresponding pore size distribution (inset). (C) Hydrodynamic diameter distribution of MMSNs. (D) Fluorescent excitation and emission spectra of FITC-MMSNs that are dispersed in PBS.
Abbreviations: FITC, fluorescein isothiocyanate; MMSNs, magnetic mesoporous silica nanoparticles; PBS, phosphate-buffered saline; STP, standard temperature and pressure; TEM, transmission electron microscope.
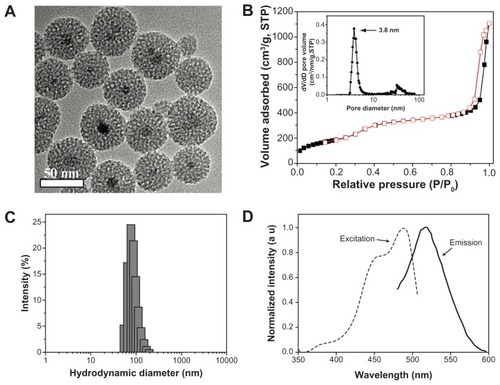
Figure 3 Adsorption profiles of DOX, RAPA, and PTX on MMSNs. (A) Adsorption isotherms for DOX, RAPA, and PTX determined at 298 K. (B) The loading-dependence curve between the hydrophobic drug (RAPA or PTX) and DOX. (C) The adsorption interactions between DOX, PTX, RAPA, and mesoporous silica matrix. DOX were attracted to the silica matrix through electrostatic interaction, while PTX and RAPA were attracted through hydrogen bonding and polar interactions.
Abbreviations: DOX, doxorubicin; MMSNs, magnetic mesoporous silica nanoparticles; PTX, paclitaxel; RAPA, rapamycin.
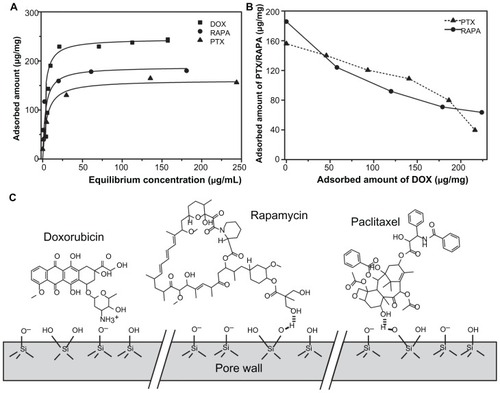
Figure 4 The release profiles of DOX on different loading fashions. DOX from individual (■), DOX-PTX co-loading (●), and DOX-RAPA co-loading (▵). The releasing experiment was carried out in PBS at 310 K. The cumulative release of DOX is about 25% in the three different situations, but the release of DOX from the individual loading system is faster than that from the co-loaded fashion.
Abbreviations: DOX, doxorubicin; PTX, paclitaxel; RAPA, rapamycin.
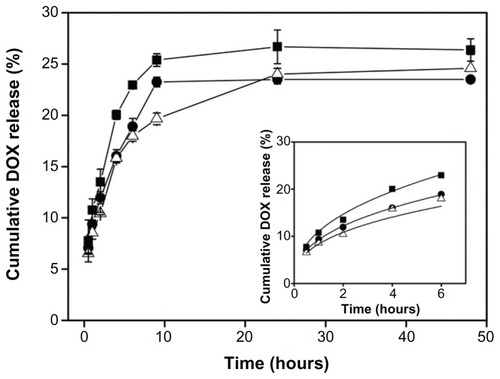
Figure 5 Intracellular distribution and drug release of drug-loaded MMSNs. A549 cells were treated by drug-loaded MMSNs for 2 hours, and then fixed and observed by confocal microscope. Both individual (A) and PTX (B) or RAPA (C) co-loaded DOX were successfully released from MMSNs, as the red fluorescence distributed in the nucleus.
Note: Scale bar: 50 μm.
Abbreviations: DOX, doxorubicin; MMSNs, magnetic mesoporous silica nanoparticles; PTX, paclitaxel; RAPA, rapamycin.
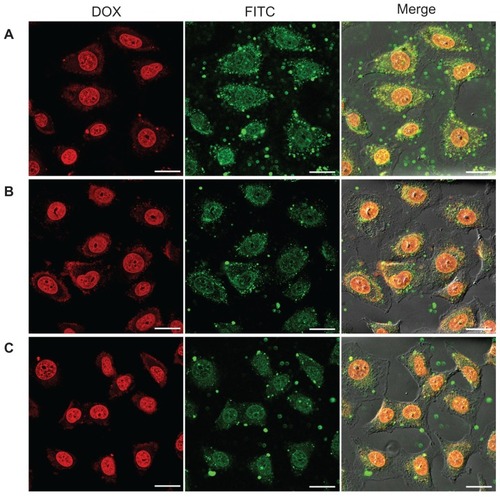
Figure 6 Apoptosis assay of A549 cells induced by single- or multidrug-loaded MMSNs. A549 cells were treated by 50 μg/mL empty nanoparticles (MMSNs), DOX-MMSNs, PTX-MMSNs, and DOX–PTX-MMSNs for 24 hours. The harvested cells were stained by Annexin V-PE/7AAD apoptosis kit, and the flow cytometry showed DOX–PTX-MMSNs induced more notable apoptotic effects than DOX-MMSNs and PTX-MMSNs. Empty MMSNs produced a negligible effect. Grey curve represents the apoptosis of untreated cells.
Abbreviations: DOX, doxorubicin; MMSNs, magnetic mesoporous silica nanoparticles; PTX, paclitaxel; RAPA, rapamycin.
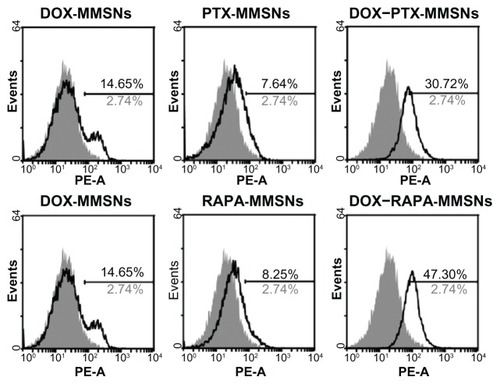
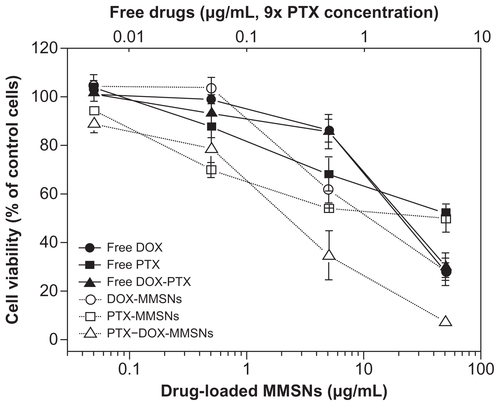
Figure 7 Tumor cell growth inhibitions induced by drug-loaded MMSNs. A549 cells were treated with empty or drug-loaded MMSNs for 48 hours. Notable cell growth suppressions were observed at: (A) 5 μg/mL of DOX–PTX-MMSNs and (B) 5–50 μg/mL of DOX–RAPA-MMSNs (P ≤ 0.05).
Abbreviations: DOX, doxorubicin; MMSNs, magnetic mesoporous silica nanoparticles; PTX, paclitaxel; RAPA, rapamycin.
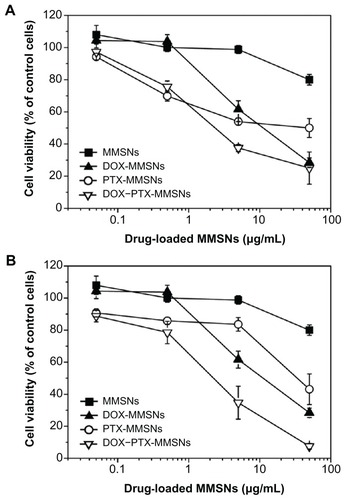
Table S1 The loading dose ratio of DOX and PTX
Table S2 The loading dose ratio of DOX and RAPA
Figure S1 The three-dimensional molecular structures of doxorubicin, paclitaxel, and rapamycin (constructed by ChemBio 3D, molecular structure based on ChemACX database). Only polar hydrogen is shown.
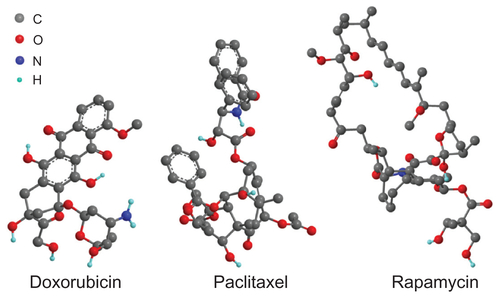
Figure S2 The cellular uptake and distribution of MMSNs on A549 cancer cells. MMSNs were labeled by FITC, and cultured with cells for 1 hour. Confocal microscopy image showed MMSNs were located in cytoplasm, and no green fluorescence was observed in nuclei which were stained by DAPI.
Note: Scale bar: 100 μm.
Abbreviations: DAPI, 4′,6-diamidino-2-phenylindole; FITC, fluorescein isothiocyanate; MMSNs, magnetic mesoporous silica nanoparticles.
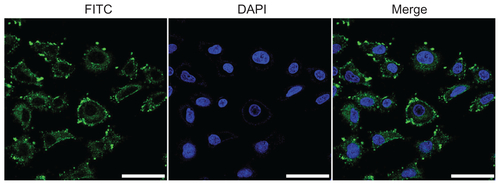
Figure S3 The cellular uptake of DOX-MMSNs and the release of DOX from MMSNs. A549 cells were treated with 50 μg/mL of DOX-MMSNs for 10, 30, 60, and 180 minutes, and observed by confocal microscopy. The internalization of MMSNs could be detected at the time point of 10 minutes as weak green fluorescence was observed. The fluorescence intensity increased accordingly with the prolonging of the treatment time. It was observed that the red fluorescence of DOX was almost undetectable until the incubating time increased to 30 min, which indicated that the nanoparticles were internalized but DOX was still kept in MMSNs until the time point of 30 minutes.
Note: Scale bar: 100 μm.
Abbreviations: DOX, doxorubicin; FITC, fluorescein isothiocyanate; MMSNs, magnetic mesoporous silica nanoparticles.
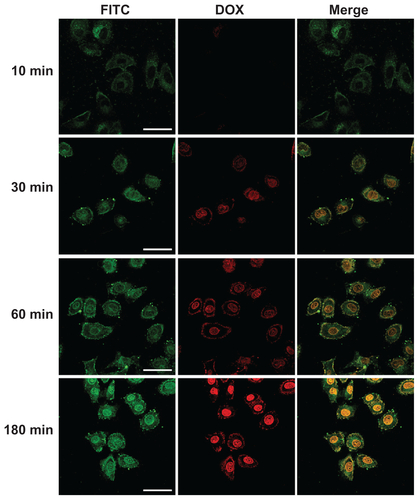
Figure S4 The fluorescence of DOX was detectable in FITC channel. (A) A549 cells were treated with free DOX in PBS at 5 μg/mL for 1 hour, fixed, and prepared for confocal microscopy. The fluorescence of DOX was mostly located in nuclei, and detectable in both 510–540 nm (FITC channel) and 560–590 nm emission range. (B) A549 cells were treated with empty MMSNs or DOX-MMSNs for 1 hour. Live cells were observed under confocal microscope. DOX-MMSNs-treated cells shows nucleic red fluorescent, whereas empty MMSNs-treated cells did not, which implies that it was the loaded DOX rather than MMSNs that entered nuclei.
Note: Scale bar: 50 μm.
Abbreviations: DOX, doxorubicin; FITC, fluorescein isothiocyanate; MMSNs, magnetic mesoporous silica nanoparticles.
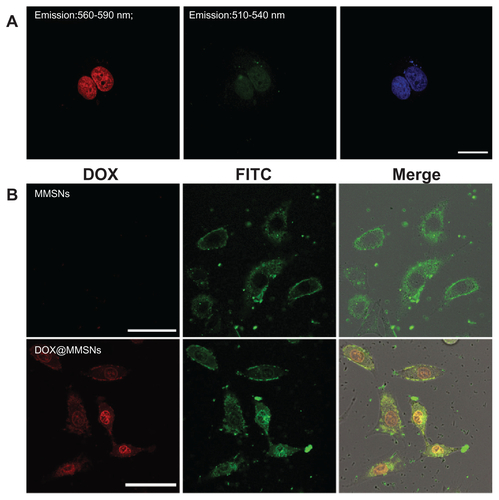
Figure S5 The growth inhibition of A549 cells induced by free or drug-loaded MMSNs with the approximate drug-loading amounts. The DOX-MMSNs loading content was 90 μg/mg, while the PTX-MMSNs loading content was 10 μg/mg. The cell growth inhibition induced by drugs loaded in MMSNs is more significant compared to that induced by free drugs.
Abbreviations: DOX, doxorubicin; MMSNs, magnetic mesoporous silica nanoparticles; PTX, paclitaxel.