Figures & data
Figure 1 Structure of wogonin derived from Scutellaria baicalensis Georgi. (A) S. baicalensis Georgi; (B) molecular structure of wogonin.
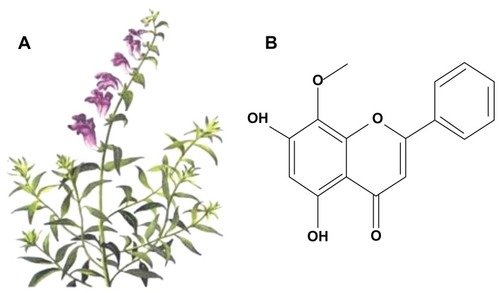
Figure 2 Physical characteristic of the citric acid-coated magnetic particles. (A) Transmission electron microscopic images of magnetic nanoparticles; (B) size distribution histogram of magnetic nanoparticles; (C) hydrodynamic particle size distribution of citric acid-coated magnetic particles.
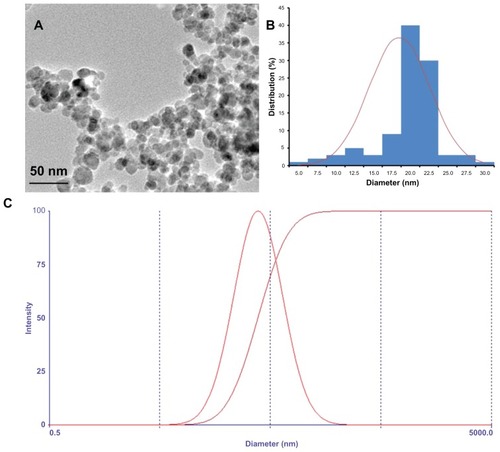
Figure 3 Viability of Raji cells treated with magnetic nanoparticles, wogonin, or wogonin-magnetic nanoparticles for 48 hours by methylthiazol tetrazolium assay. Inset: Comparison of the half maximal inhibitory concentration of wogonin and wogonin-magnetic nanoparticles at different culture times for Raji cells.
Abbreviations: MNPs, magnetic nanoparticles; IC50, half maximal (50%) inhibitory concentration.
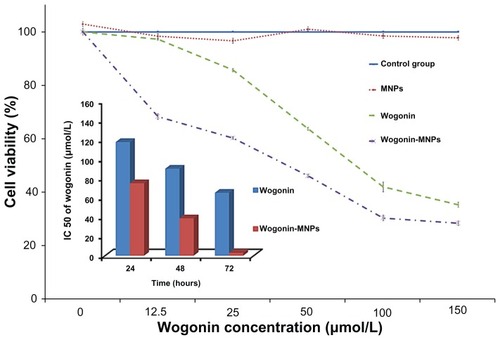
Figure 4 Inhibition rates of Raji cells treated with different concentrations of wogonin or wogonin-magnetic nanoparticles for 24, 48, and 72 hours. (A) Inhibition rates of Raji cells treated with different concentrations of wogonin or wogonin-magnetic nanoparticles for 24 hours; (B) inhibition rates of Raji cells treated with different concentrations of wogonin or wogonin-magnetic nanoparticles for 48 hours; (C) inhibition rates of Raji cells treated with different concentrations of wogonin or wogonin-magnetic nanoparticles for 72 hours; (D) inhibition rates of Raji cells treated with different concentrations of wogonin for 24, 48, and 72 hours; (E) inhibition rates of Raji cells treated with different concentrations of wogonin-magnetic nanoparticles for 24, 48, and 72 hours.
Abbreviation: MNPs, magnetic nanoparticles.
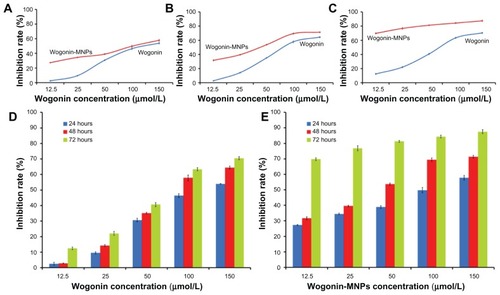
Table 1 Cell cycle distributions of Raji cells
Figure 5 Cell cycle distributions of Raji cells treated with wogonin or wogonin-magnetic nanoparticles for 48 hours. (A) Control group; (B) 80 mg/L magnetic nanoparticles; (C) 12.5 μmol/L wogonin; (D) 12.5 μmol/L wogonin-magnetic nanoparticles; (E) 50 μmol/L wogonin; (F) 50 μmol/L wogonin-magnetic nanoparticles.
Abbreviation: MNPs, magnetic nanoparticles.
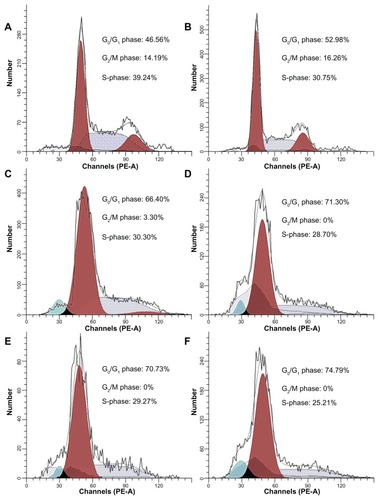
Figure 6 Apoptotic rates of Raji cells treated with magnetic nanoparticles, wogonin, or wogonin-magnetic nanoparticles for 48 hours. (A) Control group; (B) 80 mg/L magnetic nanoparticles; (C) 12.5 μmol/L wogonin; (D) 12.5 μmol/L wogonin-magnetic nanoparticles; (E) 50 μmol/L wogonin; (F) 50 μmol/L wogonin-magnetic nanoparticles.
Abbreviations: FITC-H, peak height of fluorescein isothiocyanate channel; MNPs, magnetic nanoparticles; PI, propidium iodide; PE-H, peak height of phycoerythrin channel; Q1, necrosis; Q2, late apoptosis; Q3, healthy cells; Q4, early apoptosis.
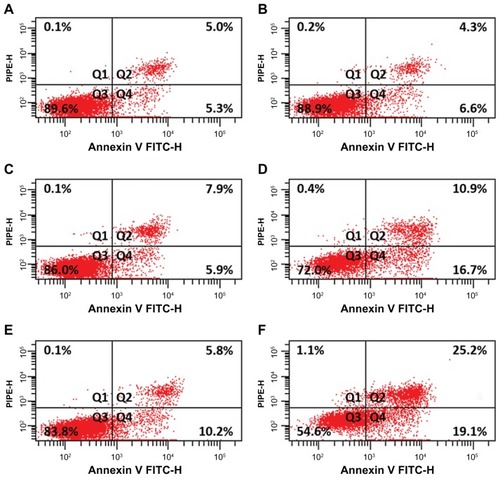
Figure 7 Morphologic characterization of Raji cells after different treatments for 48 hours under inverted fluorescence micrographs (100×, 4′,6-diamidino-2-phenylindole staining). (A) Control group; (B) 80 mg/L magnetic nanoparticles; (C) 12.5 μmol/L wogonin; (D) 12.5 μmol/L wogonin-magnetic nanoparticles; (E) 50 μmol/L wogonin; (F) 50 μmol/L wogonin-magnetic nanoparticles.
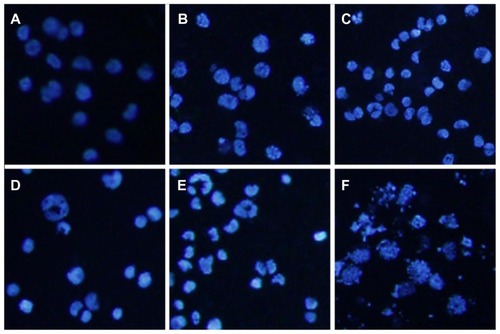
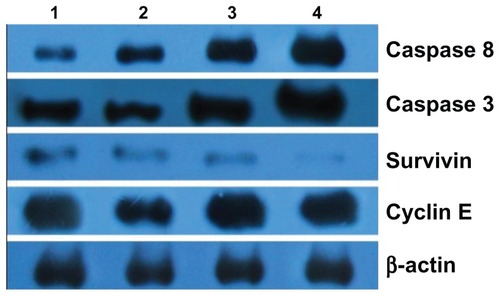
Figure 8 Expression of caspase 3, caspase 8, survivin, and cyclin E protein in Raji cells by western blot after treatment of wogonin with or without magnetic nanoparticles for 48 hours. Lane 1, control group; Lane 2, 80 mg/L magnetic nanoparticles; Lane 3, 12.5 μmol/L wogonin; Lane 4, 12.5 μmol/L wogonin-magnetic nanoparticles.