Figures & data
Figure 1 Transmission electron microscopy of hydroxyapatite nanoparticles synthesized at (A) 140°C (n-HA1) and (B) 80°C (n-HA2).
Abbreviation: n-HA, nanohydroxyapatite.
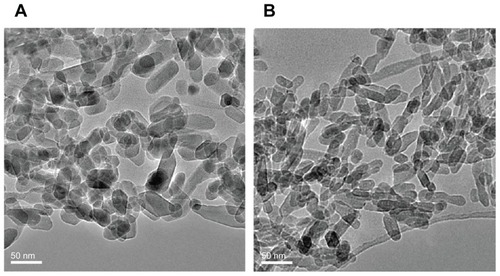
Figure 2 X-ray diffraction patterns of n-HA1 and n-HA2.
Abbreviations: n-HA, nanohydroxyapatite; cps, counts per second.
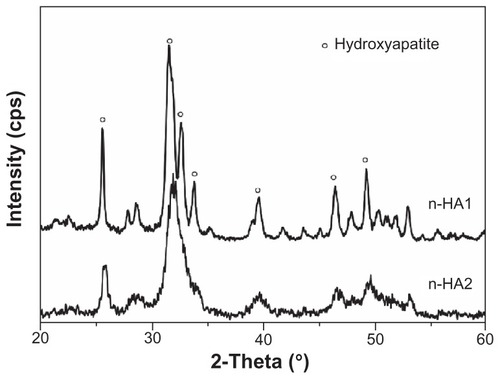
Figure 3 Fourier transform infrared spectroscopic patterns of n-HA1 and n-HA2.
Abbreviation: n-HA, nanohydroxyapatite.
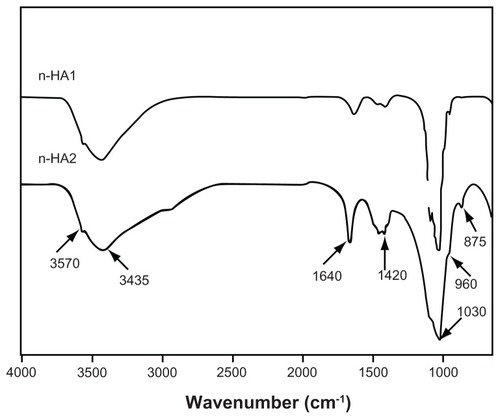
Figure 4 Viability of osteoblast cells responding to different nanohydroxyapatite particles at various time points by MTT analysis.
Note: *P < 0.05 compared with controls.
Abbreviations: MTT, 3-(4, 5-dimethylthiazol-2-yl)-2, 5-diphenyltetrazolium bromide; n-HA, nano-hydroxyapatite; OD, optical density.
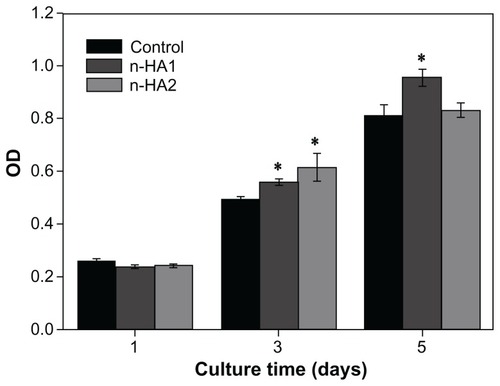
Figure 5 Field emission scanning electron microscopic images of MG-63 cells cocultured with different nanohydroxyapatite particles for 5 days: (A and B) as controls; (C and D) n-HA1; (E and F) n-HA2.
Abbreviation: n-HA, nanohydroxyapatite.
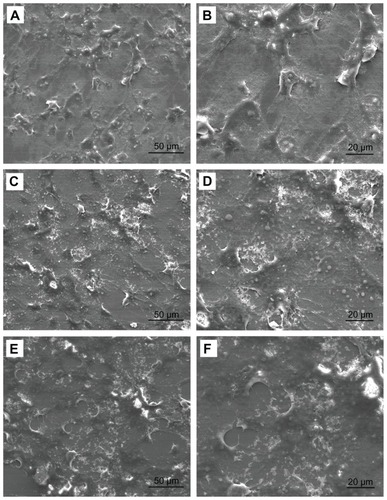
Figure 6 Actin cytoskeletal organization (red, labelled with rhodamine-phalloidin, counterstained with DAPI for nuclei in blue) of MG-63 cells after incubation with n-HA1 and n-HA2 for 5 days: (A and B) control cells; (C and D) n-HA1; (E and F) n-HA2. Cells with the n-HA1 material tended to have a more organized actin cytoskeleton.
Abbreviation: n-HA, nanohydroxyapatite.
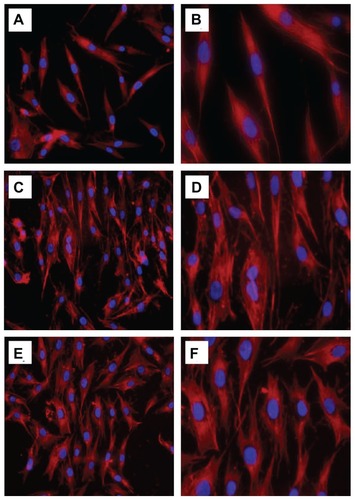
Figure 7 Flow cytometric analyses of MG-63 cells apoptosis after treatment with n-HA1 and n-HA2 for 5 days. (A) Typical figures for flow cytometric analyses of apoptotic cells (x-axis, Annexin V-FITC) versus (y-axis, propidium iodide fluorescence). (B) Percentages of apoptotic cells. The percentage of cells was calculated using Summit 5.0 software.
Notes: Data are presented as the mean ± standard deviation of three separate experiments (n = 4). **P < 0.01.
Abbreviations: Annexin-V FITC, Annexin-V fluorescein isothiocyanate; n-HA, nanohydroxyapatite.
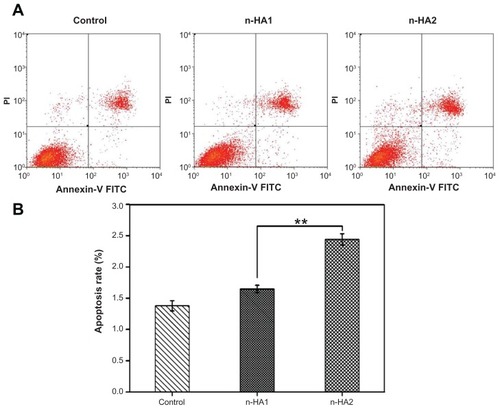
Figure 8 Alkaline phosphatase activity of MG-63 cells after incubation with n-HA1 and n-HA2 for 5 days.
Note: *P < 0.05 compared with control.
Abbreviations: ALP, alkaline phosphatase; n-HA, nanohydroxyapatite.
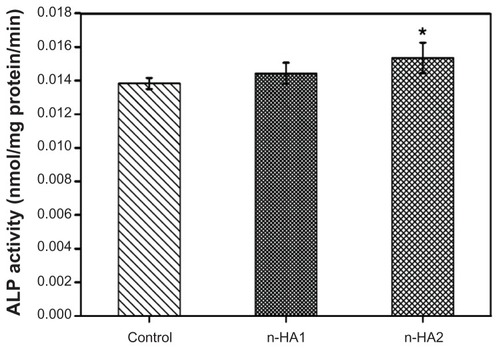
Figure 9 Collagen I and osteopontin synthesis by MG-63 cells cultured with the control, n-HA1, and n-HA2 were determined by Western blotting. Similar results were obtained in four separate experiments.
Abbreviation: n-HA, nanohydroxyapatite.
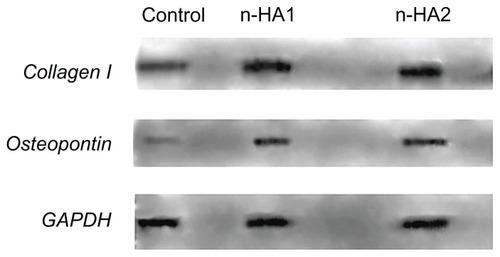
Figure 10 TNF-α protein production by the human macrophage U937 exposed to nanohydroxyapatite over 18 hours.
Notes: Data are presented as the mean ± standard deviation of three separate experiments (n = 3). **P < 0.01.
Abbreviations: TNF-α, tumor necrosis factor alpha; n-HA, nanohydroxyapatite.
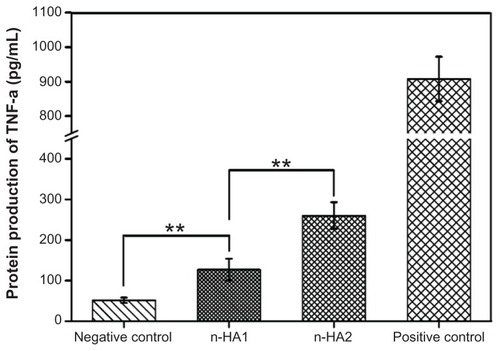
Figure 11 Transmission electron microscopic images of MG-63 cells exposed to n-HA1 and n-HA2 for 5 days. (A) n-HA1 was close to the nuclear envelope, but did not enter into the cell nucleus. (B) n-HA2 lead to a change in nuclear morphology.
Abbreviations: n-HA, nanohydroxyapatite; N, nucleus.
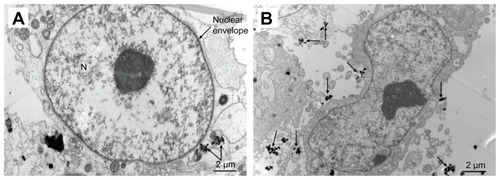
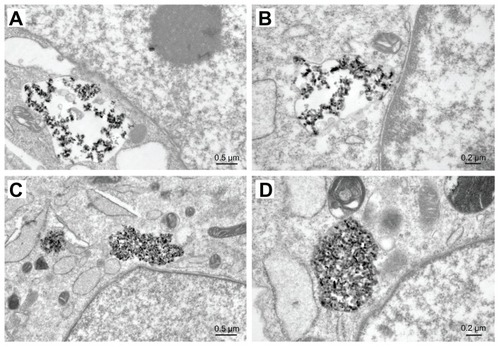
Figure 12 Dissolution of n-HA1 (A) and n-HA2 (C) in MG-63 cells containing lysosomes. After phagocytosis, the particles were scattered and retained their original size and shape within phagosomes. n-HA2 was compacted very tightly and a proportion of the particles began to dissolve. The images in (B and D) represent closer observation.
Abbreviation: n-HA, nanohydroxyapatite.