Figures & data
Figure 1 Transmission electron microscopy images of n-TiO2 in TiO2/poly(ether-ether- ketone) composite.
Note: Bar, 50 nm.
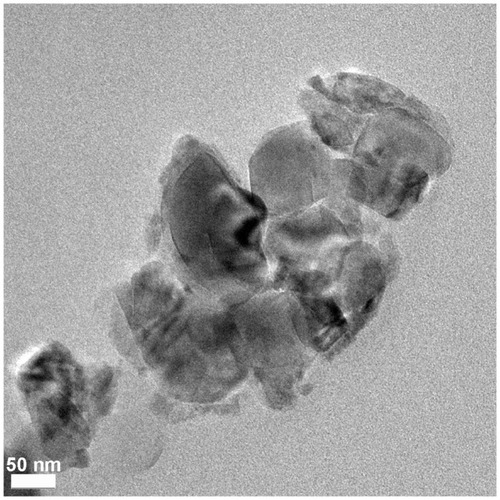
Figure 2 Scanning electron microscopy images of PEEK and n-TiO2/PEEK before and after blasted treatment. (A1) Smooth PEEK, (A2) rough PEEK, (B1) smooth n-TiO2/PEEK, and (B2) rough n-TiO2/PEEK.
Notes: *n-TiO2 particles exposed to the surface of smooth n-TiO2/PEEK. (A1, A2, B1, and B2 bars, 20.0 μm; B1 bar, 250.0 nm).
Abbreviation: PEEK, poly(ether-ether-ketone).
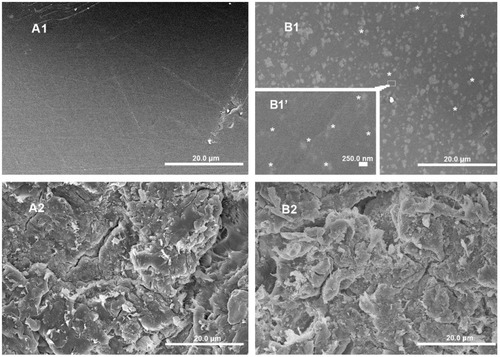
Figure 3 X-ray photoelectron spectroscopy of PEEK (A) and n-TiO2/PEEK composite (B).
Abbreviation: PEEK, poly(ether-ether-ketone).
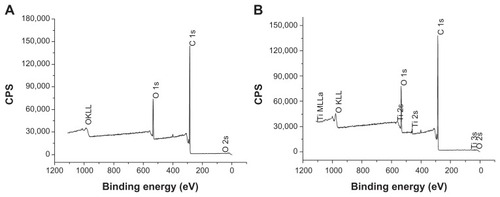
Figure 4 Cell attachment on PEEK and n-TiO2/PEEK before and after blasted treatment. (A1) Smooth PEEK, (A2) rough PEEK, (B1) smooth n-TiO2/PEEK, and (B2) rough n-TiO2/PEEK.
Note: *P < 0.05.
Abbreviations: OD, optical density; PEEK, poly(ether-ether-ketone).
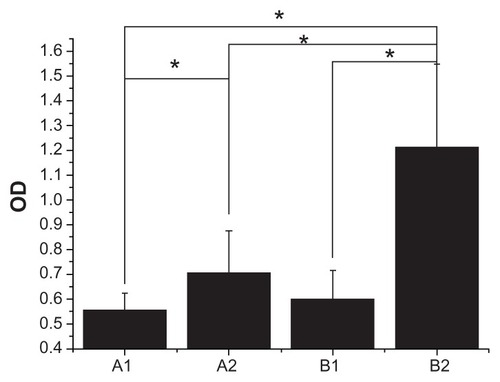
Figure 5 Cytotoxicity of the samples, smooth PEEK, rough PEEK, smooth n-TiO2/PEEK and rough n-TiO2/PEEK, after 3, 7, and 14 days as measured by WST-1 assay.
Note: *P < 0.05.
Abbreviation: PEEK, poly(ether-ether-ketone).
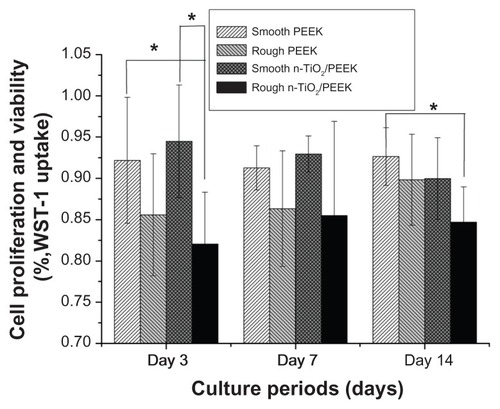
Figure 6 Cell morphology. (A1), (A2), (B1), and (B2) MG-63 cells cultured on disks of smooth PEEK, rough PEEK, smooth n-TiO2/PEEK and rough n-TiO2/PEEK for 3 days (A1, A2, B1 and B2), 7 days (A1, A2, B1 and B2) and 14 days (A1, A2, B1 and B2), respectively.
Note: Bar 20.0 μm.
Abbreviation: PEEK, poly(ether-ether-ketone).
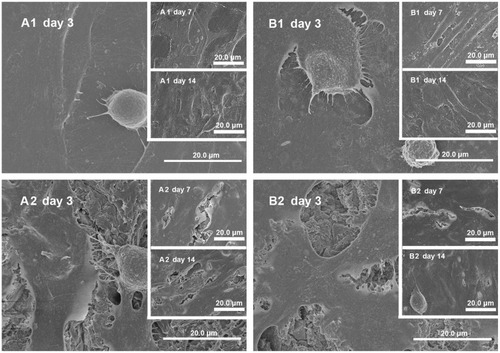
Figure 7 Cell cycle analysis of osteoblasts grown on smooth PEEK, rough PEEK, smooth n-TiO2/PEEK, and rough n-TiO2/PEEK for 3, 7, and 14 days.
Note: *P < 0.05.
Abbreviation: PEEK, poly(ether-ether-ketone).
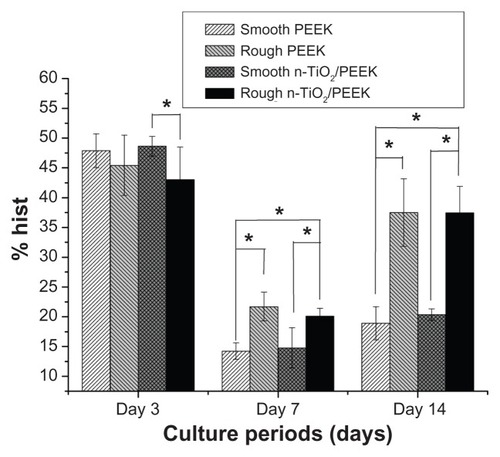
Figure 8 BV/TV of PEEK (A) and n-TiO2/PEEK (B) was calculated after microcomputed tomography.
Note: *P < 0.05.
Abbreviations: BV/TV, percent bone volume; PEEK, poly(ether-ether-ketone).
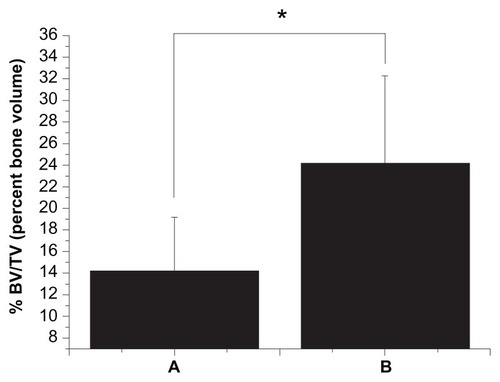
Figure 9 Three-dimensional images showing regeneration of microstructures about 0.5 mm in thickness bonding to PEEK (A) and n-TiO2/PEEK (B) implants in the marrow.
Abbreviation: PEEK, poly(ether-ether-ketone).
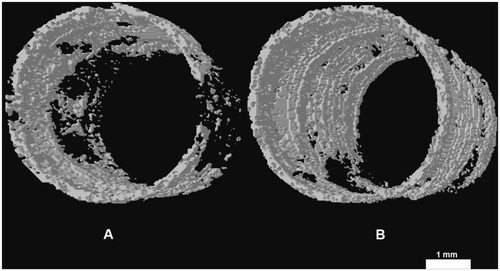
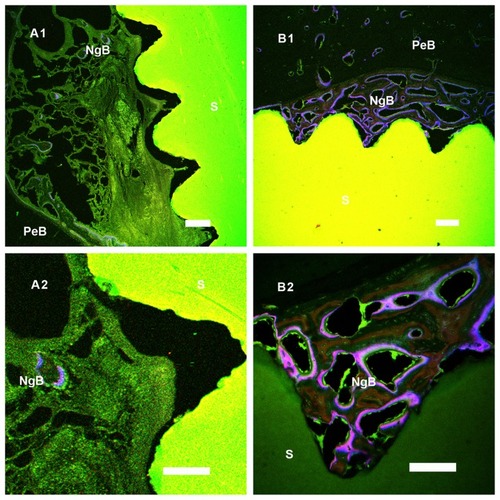
Figure 10 In histological analysis, new bone formation around the PEEK and n-TiO2/PEEK were detected by bone labelling (calcein, calcein blue, and tetracycline). Group A was PEEK and group B was n-TiO2/PEEK. Original magnification of (A1) and (B1) was 5× and (A2) and (B2) was 20×.
Notes: A1 and B1 bar, 200 μm; A2 and B2 bar, 100 μm.
Abbreviations: S, sample; NgB, newly grown bone deposition and remodeling zone; PeB, pre-existing bone tissue zone; PEEK, poly(ether-ether-ketone).