Figures & data
Scheme 1 (A) SPIO@PSS/CDDP/HSA−MTX NPs were prepared using the Layer-by-Layer technique. (B) Schematic representation of SPIO@PSS/CDDP/HSA−MTX NPs used for lung cancer therapy using loco-regional hyperthermia combined with chemotherapy.
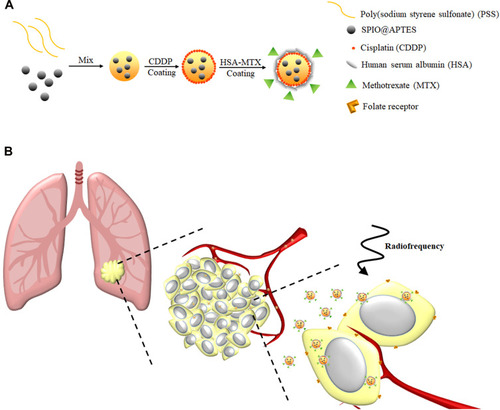
Table 1 Relative Intensity Ratio of N—H Bending Vs C═O Stretching in HSA and HSA–MTX Conjugate
Figure 1 (A) FT-IR spectra and (B) UV-vis spectra of HSA, MTX, and HSA–MTX conjugates.
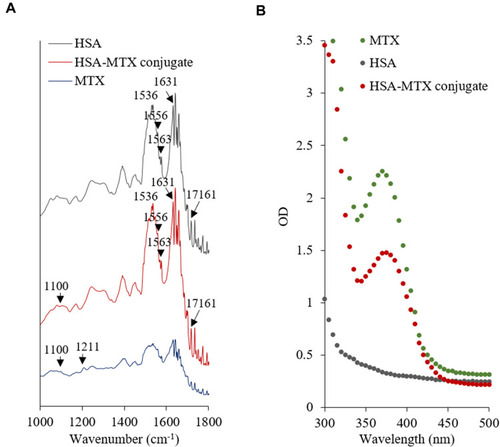
Table 2 Particle Size and Loading Efficiency of CDDP in the Prepared Nanoparticles
Figure 2 (A) The size distribution of nanoparticles after layer-by-layer coating with PSS, CDDP, and HSA or HSA–MTX conjugates. (B) The zeta potential of nanoparticles after layer-by-layer coating with PSS, CDDP, and HSA or HSA–MTX conjugates. (C) Transmission electron microscopy (TEM) images of SPIO, SPIO@APTES, SPIO@PSS, SPIO@PSS/CDDP, SPIO@PSS/CDDP/HSA, and SPIO@PSS/CDDP/HSA–MTX nanoparticles. Samples were negatively stained with 2% uranyl acetate (UA) before imaging. Scale bar=100 nm.
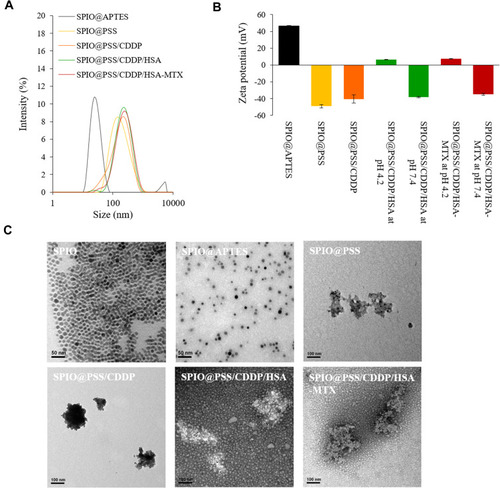
Figure 3 Stability of SPIO@PSS/CDDP/HSA and SPIO@PSS/CDDP/HSA–MTX nanoparticles, as revealed by relative diameter change compared to the particle size at Day 0 (D/D0) in (A) PBS, (B) saline, and (C) DMEM supplemented with 10% FBS.
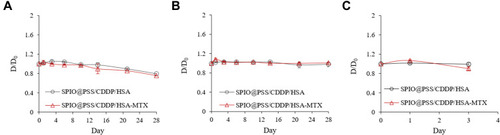
Figure 4 (A) Heating curves for H2O, PRMI-1640 medium, SPIO@APTES, SPIO@PSS/CDDP/HSA, and SPIO@PSS/CDDP/HSA–MTX nanoparticles. The concentration of SPIO@APTES was 0.622 mg/mL. (B) Number-based particle size distribution of SPIO@PSS/CDDP/HSA and SPIO@PSS/CDDP/HSA−MTX nanoparticles with or without RF exposure. (C) TEM images showing that RF irradiation affected the morphology of SPIO@PSS/CDDP/HSA and SPIO@PSS/CDDP/HSA−MTX nanoparticles. Scale bar=200 nm.
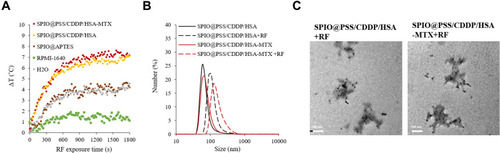
Figure 5 (A) The viability of NCI-H661 and A549 cells after treatment with CDDP, SPIO@PSS/HSA, SPIO@PSS/CDDP/HSA, SPIO@PSS/HSA–MTX, and SPIO@PSS/CDDP/HSA–MTX nanoparticles for 48 h. (B) Cellular uptake of SPIO@PSS/CDDP/HSA and SPIO@PSS/CDDP/HSA–MTX nanoparticles in NCI-H661 and A549 cells with or without 2 mM folic acid pre-treatment. (C) Relative fluorescent intensity of FITC in NCI-H661 and A549 cells, with * indicating p < 0.05.
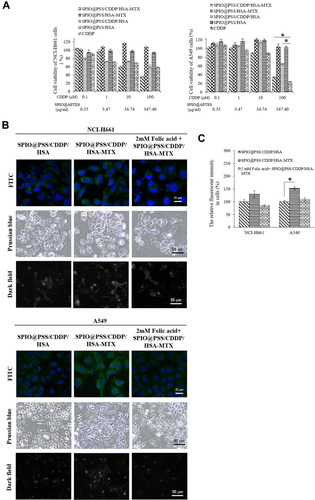
Figure 6 Viability of NCI-H661 and A549 cells treated with SPIO@PSS/HSA–MTX and SPIO@PSS/CDDP/HSA–MTX at various CDDP concentrations and RF (2.24 kW) exposure periods. * indicates p < 0.05.
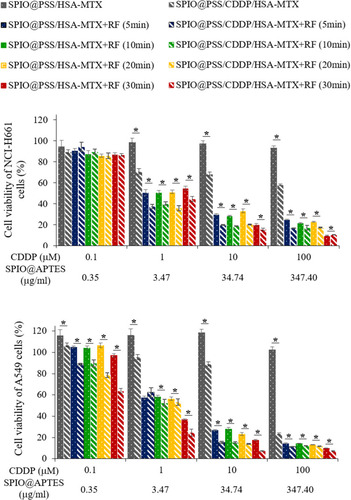
Figure 7 (A) Relative tumor volume, (B) representative tumor images, and (C) H&E-stained images of tumor tissue treated with saline, free CDDP, SPIO@PSS/CDDP/HSA–MTX, SPIO@PSS/HSA–MTX, or SPIO@PSS/CDDP/HSA–MTX with RF generator irradiation (2.24 kW, 30 minutes) at 24 days. Scale bar=100 µm. * indicates p < 0.05.
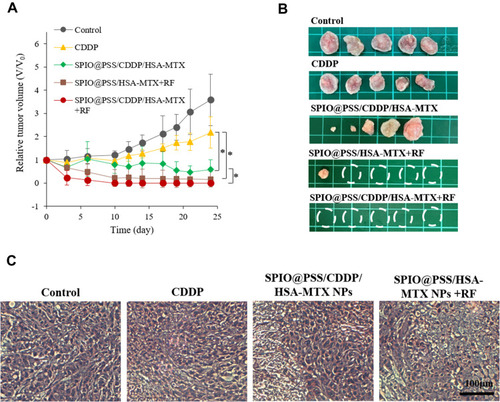
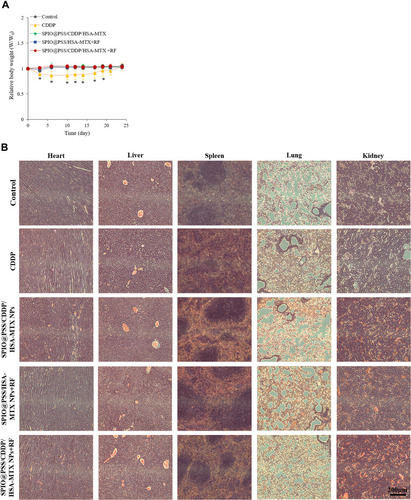
Figure 8 (A) Relative body weights of nude mice and (B) H&E-stained images of heart, liver, spleen, lung, and kidney tissue in mice after treatment with saline, free CDDP, SPIO@PSS/CDDP/HSA–MTX, SPIO@PSS/HSA–MTX, or SPIO@PSS/CDDP/HSA–MTX with RF generator irradiation (2.24 kW, 30 minutes) at 24 days. Scale bar=200 µm. * indicates p < 0.05.