Figures & data
Table 1 Physicochemical parameters of squalenoyl nanoaggregatesTable Footnote*
Figure 1 Transmission electron micrograph of the Sq-Ara-C nanoaggregates (A). Interaction between [3H]CHE radiolabeled Sq-Ara-C and the different cancer cell lines (B). Confocal laser scanning micrograph (C), relative three-dimensional image (D) and 4× zoom (E) showing the interaction between MCF-7 cells and the fluorescein-DHPE-labeled Sq-Ara-C nanoaggregates after 3 hours of incubation.
![Figure 1 Transmission electron micrograph of the Sq-Ara-C nanoaggregates (A). Interaction between [3H]CHE radiolabeled Sq-Ara-C and the different cancer cell lines (B). Confocal laser scanning micrograph (C), relative three-dimensional image (D) and 4× zoom (E) showing the interaction between MCF-7 cells and the fluorescein-DHPE-labeled Sq-Ara-C nanoaggregates after 3 hours of incubation.](/cms/asset/3c1cfa78-4aac-4fac-8300-b30b8f1b7c27/dijn_a_28114_f0001_c.jpg)
Table 2 Evaluation of IC50 (μM) of Ara-C and Sq-Ara-C in different cancer cell linesTable Footnote*
Table 3 Evaluation of physiological parameters in mice treated with the different formulations
Figure 2 Survival profile of mice inoculated intravenously with 1 × 10⁵ L1210R cells and treated with the different formulations.
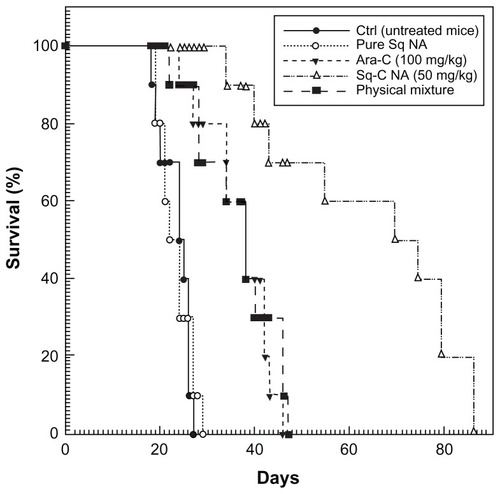
Figure 3 Biodistribution of [3H]CHE radiolabeled Sq-Ara-C nanoaggregates in DBA/2 mice as a function of time.
![Figure 3 Biodistribution of [3H]CHE radiolabeled Sq-Ara-C nanoaggregates in DBA/2 mice as a function of time.](/cms/asset/df17d6c4-52c3-4639-baeb-07838b600f89/dijn_a_28114_f0003_c.jpg)
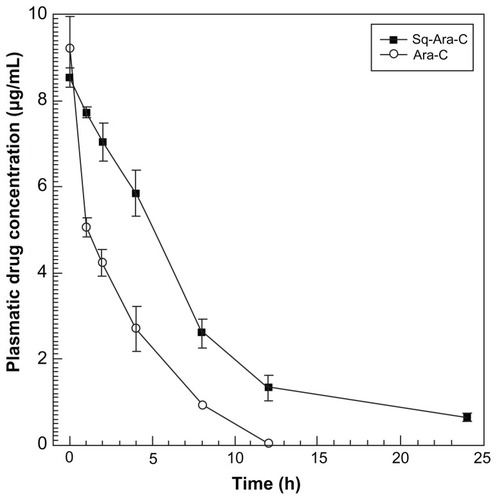
Figure 4 Pharmacokinetic profiles for free Ara-C and Sq-Ara-C in DBA/2 mice following intravenous administration of a 1 mg/kg dose.
Note: Data are the mean of three independent experiments ± standard deviation.
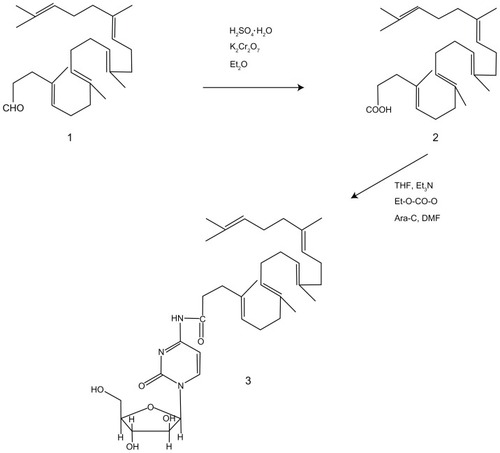
Scheme 1 Synthesis of 4-(N)-1,1′,2-tris-nor-squalenoyl-cytarabine (Sq-Ara-C, compound 3) starting from 1,1′,2-tris-nor-squalene aldehyde (compound 1), which was first oxidized into 1,1′,2-tris-nor-squalene acid (compound 2) and then conjugated with Ara-C.