Figures & data
Figure 1 (A) Focused-ion beam microscopy image of G-chitosan-coated boron nitride nanotubes (BNNTs) and (B) transmission electron microscopy analysis showing the typical BNNT structure.
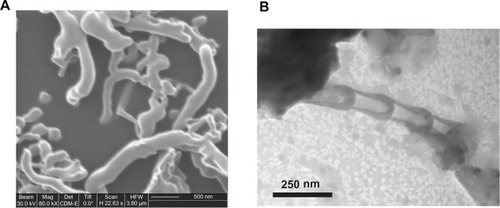
Figure 2 (A) Height and (B) phase atomic force microscopy images of G-chitosan coated boron nitride nanotubes.
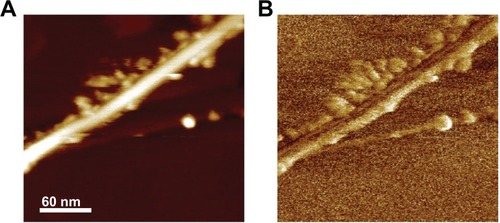
Figure 3 (A) Size distribution and (B) Z-potential analyses of the injected boron nitride nanotube dispersions.
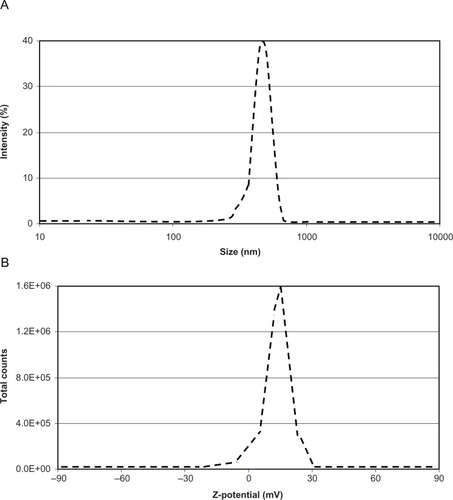
Table 1 Blood analyses to evaluate hematic parameters and liver and kidney functionality