Figures & data
Figure 1 Model of the endotracheal tube (ETT) system used in this study.Citation29
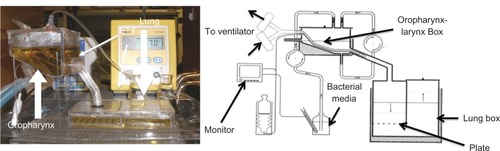
Figure 2 Diagram of endotracheal tube (ETT) curvature.Citation31
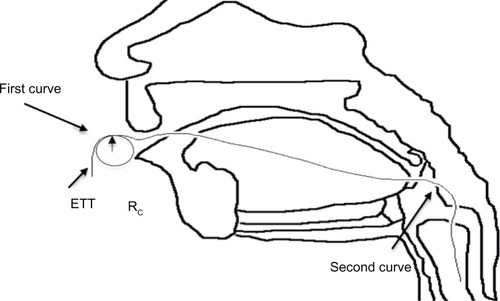
Figure 3 Scanning electron microscopy images of nanomodified and untreated polyvinyl chloride endotracheal tubes. (A) Nano-R: mag ×20 K. (B) Untreated: mag ×30 K. Nano-R was modified with Rhizopus arrhisus.
Note: Scale bars = 2 μm.
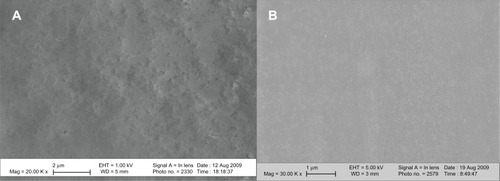
Figure 4 Atomic force microscopy images of polyvinyl chloride endotracheal tubes treated with (A) 0.1% Rhizopus arrhisus solution (Nano-R) for 48 hours compared with (B) untreated polyvinyl chloride samples.
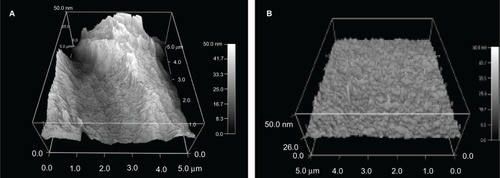
Figure 5 X-ray photoelectron spectroscopy of nanomodified and untreated polyvinyl chloride (PVC) endotracheal tubes (Nano-R). Nano-R was modified with Rhizopus arrhisus.
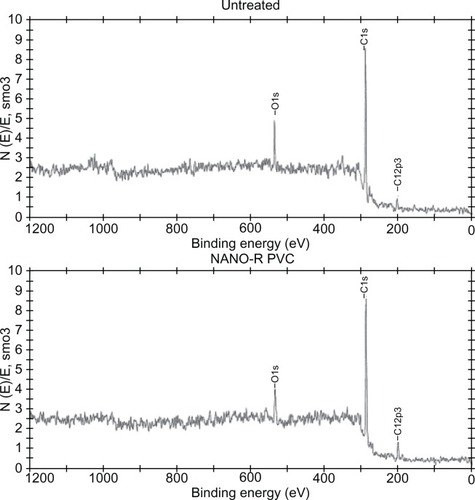
Figure 6 Increased hydrophilicity of nanomodified polyvinyl chloride endotracheal tubes (Nano-R) compared with controls. Nano-R was modified with Rhizopus arrhisus.
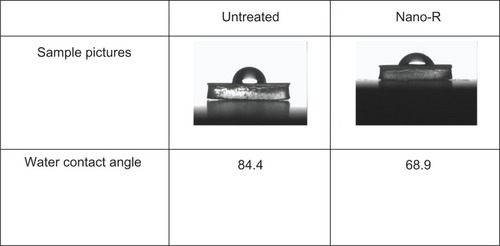
Figure 7 Increased total protein adsorption on nanomodified polyvinyl chloride (PVC) endotracheal tubes (Nano-R) compared with controls. Nano-R was modified with Rhizopus arrhisus.
Notes: Data = mean ± scanning electron microscopy; N = 3; *P < 0.01 compared with untreated.
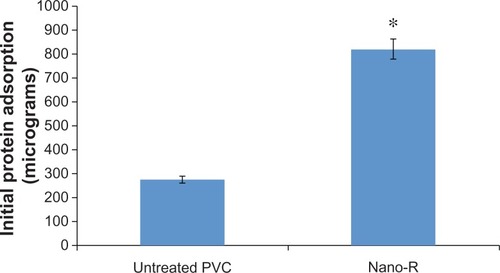
Figure 8 Dynamic lung system results for untreated tubes versus nanomodified polyvinyl chloride endotracheal tubes (ETTs): crystal violet stain; N = 3 (x-axis length = longitudinal ETT length); blank = sterile ETTs soaked in trypticase soy broth medium.
Notes: Error bars ± 1standard error; *P < 0.05 compared with untreated ETTs at the same time points.
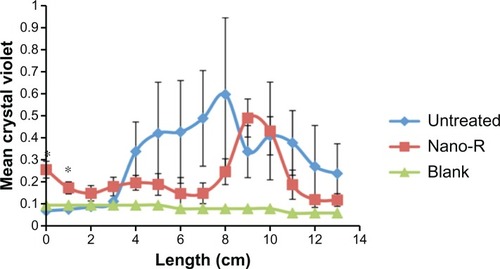
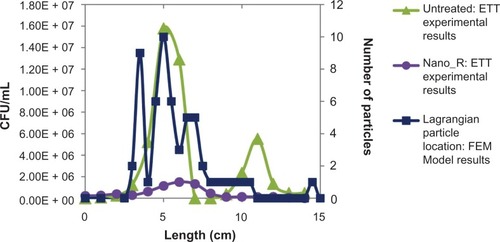
Figure 9 Dynamic lung system results for untreated versus nanomodified versus nanomodified polyvinyl chloride endotracheal tubes (ETTs): colony counts of Staphylococcus aureus;
Notes: N = 3 (x-axis length = longitudinal ETT length); error bars ± 1standard error; *P < 0.05 and **P < 0.01 compared with untreated ETTs at the same time points.
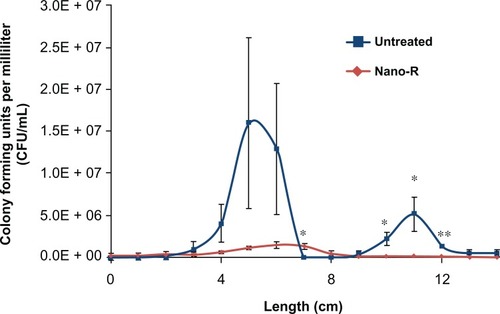
Figure 10 Field emission microscopy (FEM) model: (A) velocity magnitude longitudinal slice of ETT (B) velocity magnitude cross section: first curve, (C) velocity magnitude cross section: second curve, and (D) maximum shear stress versus bacterial density.
Note: Results show a correlation of shear stress to increased bacteria function for the first curve but not the second curve.
Abbreviations: CFU, colony-forming unit; ETT, endotracheal tube.
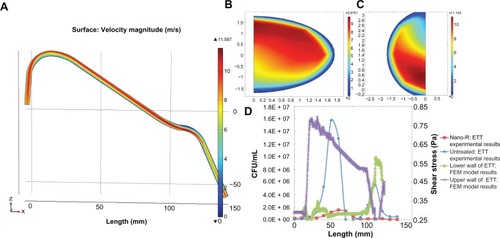
Figure 11 Field emission microscopy (FEM) model. Particle distribution versus bacterial density.
Note: Results show increased particle (representing bacteria) residence time in both curves of the endotracheal tube (ETT).
Abbreviation: CFU, colony-forming unit.
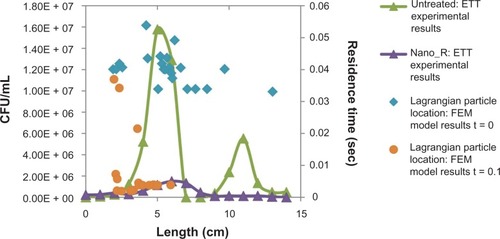
Figure 12 Field emission microscopy (FEM) model. Particle distribution versus bacterial density.
Abbreviations: CFU, colony-forming unit; ETT, endotracheal tube.