Figures & data
Figure 1 (A) Hemolytic activity of self-assembling peptide RADA16-I evaluated using rabbit red blood cells after 3 h of incubation. (i) Hemolysis of red blood cells in RADA16-I water solution, PBS and pure water; (ii) Full-wavelength scanning of positive control tube H2O and PBS, RADA16-I solutions; (iii) Statistical analysis of hemolysis rate of RADA16-I solutions. (B) Cellular toxicity of RADA16-I. Data were calculated from three independent experiments. #P<0.05, *P<0.01.
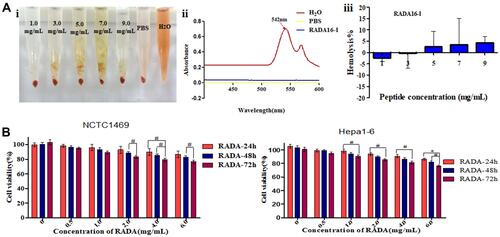
Figure 2 Formation of RADA16-I-EM suspension-in situ hydrogel system.
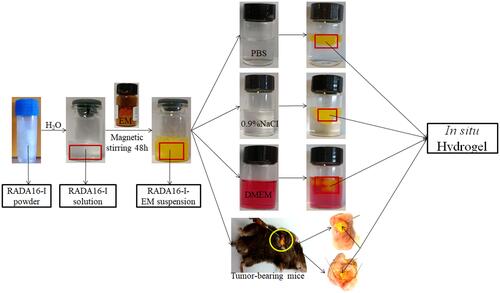
Figure 3 Inhibition effects of free EM (water suspension), RADA16-I-EM in situ hydrogels incubated 24 and 72 hours on proliferation of cells. [RADA16-I] =5 mg/mL; Data were calculated from three independent experiments. #P<0.05, *P<0.01.
![Figure 3 Inhibition effects of free EM (water suspension), RADA16-I-EM in situ hydrogels incubated 24 and 72 hours on proliferation of cells. [RADA16-I] =5 mg/mL; Data were calculated from three independent experiments. #P<0.05, *P<0.01.](/cms/asset/be00db3c-9c38-4fa5-9172-7eaff60caee9/dijn_a_12192158_f0003_c.jpg)
Figure 4 (A) Confocal images of Hepa1-6 cells incubated with free EM (water suspension) and RADA16-I-EM hydrogels at 24 h. Blue and green colors represent DAPI and EM, respectively; Scale bars are 30 μm. [EM] = 120, 160, 200 μM. (B) Flow cytometry of uptake EM (left) and quantification (right) after 24 h incubation. The data were presented as the mean ± SD, n = 3. 1, 2 and 3 represent EM concentrations of 120, 160, 200 μM, respectively, [RADA16-I] = 5 mg/mL, #P<0.05, *P<0.01 vs free EM.
![Figure 4 (A) Confocal images of Hepa1-6 cells incubated with free EM (water suspension) and RADA16-I-EM hydrogels at 24 h. Blue and green colors represent DAPI and EM, respectively; Scale bars are 30 μm. [EM] = 120, 160, 200 μM. (B) Flow cytometry of uptake EM (left) and quantification (right) after 24 h incubation. The data were presented as the mean ± SD, n = 3. 1, 2 and 3 represent EM concentrations of 120, 160, 200 μM, respectively, [RADA16-I] = 5 mg/mL, #P<0.05, *P<0.01 vs free EM.](/cms/asset/7122407a-1a94-4fda-a90f-8c12b6f7e9ca/dijn_a_12192158_f0004_c.jpg)
Figure 5 Flow cytometry results for cancer cells. Percentage of apoptosis cells (Q2+Q4) were compared among groups. The data were presented as the mean ± SD, n = 3. 1, 2 and 3 represent EM concentrations of 120, 160, 200 μM, respectively, [RADA16-I] = 5 mg/mL, #P<0.05, *P<0.01 vs free EM or the control.
![Figure 5 Flow cytometry results for cancer cells. Percentage of apoptosis cells (Q2+Q4) were compared among groups. The data were presented as the mean ± SD, n = 3. 1, 2 and 3 represent EM concentrations of 120, 160, 200 μM, respectively, [RADA16-I] = 5 mg/mL, #P<0.05, *P<0.01 vs free EM or the control.](/cms/asset/313f5496-f3a0-40f1-a3d0-b5f04bfacc07/dijn_a_12192158_f0005_c.jpg)
Figure 6 Hepa1-6 cells incubated with free EM (water suspension) or RADA16-I-EM hydrogels for 24 h and the cell cycles analyzed under flow cytometry. The percentage of G0/G1, S and G2/M phase distributions of free EM or RADA16-I-EM hydrogels treated cells was measured by ModFit. LT 3.3 software. 1, 2 and 3 represent EM concentrations of 120, 160, 200 μM, respectively, [RADA16-I] = 5 mg/mL.
![Figure 6 Hepa1-6 cells incubated with free EM (water suspension) or RADA16-I-EM hydrogels for 24 h and the cell cycles analyzed under flow cytometry. The percentage of G0/G1, S and G2/M phase distributions of free EM or RADA16-I-EM hydrogels treated cells was measured by ModFit. LT 3.3 software. 1, 2 and 3 represent EM concentrations of 120, 160, 200 μM, respectively, [RADA16-I] = 5 mg/mL.](/cms/asset/d38a7dd8-08d2-405d-b7c8-09779b679689/dijn_a_12192158_f0006_c.jpg)
Figure 7 (A) Representative results of Transwell migration/invasion assays and corresponding quantification in Hepa1-6 cells after treatment with free EM (water suspension) or RADA16-I-EM hydrogels for 24 h (Scale bar = 200 μm). (B) The colony-formation results of Hepa1-6 cells after treatments of free EM and RADA16-I-EM hydrogels for 24 h were exhibited. 1, 2 and 3 represent EM concentrations of 120, 160, 200 μM, respectively. [RADA16-I] = 5 mg/mL. Data are presented as mean ± SD of three independent experiments conducted in duplicate, #P<0.05; *P<0.01 vs EM or Control group.
![Figure 7 (A) Representative results of Transwell migration/invasion assays and corresponding quantification in Hepa1-6 cells after treatment with free EM (water suspension) or RADA16-I-EM hydrogels for 24 h (Scale bar = 200 μm). (B) The colony-formation results of Hepa1-6 cells after treatments of free EM and RADA16-I-EM hydrogels for 24 h were exhibited. 1, 2 and 3 represent EM concentrations of 120, 160, 200 μM, respectively. [RADA16-I] = 5 mg/mL. Data are presented as mean ± SD of three independent experiments conducted in duplicate, #P<0.05; *P<0.01 vs EM or Control group.](/cms/asset/906e9a28-22e9-47be-9281-33fd8b9e2104/dijn_a_12192158_f0007_c.jpg)
Figure 8 In vivo therapeutic efficiency of C57 mice with Hepa1-6 xenograft model was treated with RADA16-I, EMS or RADA16-I-EM. (A) Illustration of RADA16-I encapsulated EM. (B) Illustration of RADA16-I/EMS/RADA16-I-EM for the intra-tumor administration of tumor-bearing mice. (C) Body weight change in various groups. (D) Tumor volume change in various groups. (E) The images of dissected tumor tissues. (F) Tumor weight was recorded after the last injection. *P<0.01 vs PBS; #P<0.05 vs EMS or PBS. Data are presented as mean ± SD (n = 8).
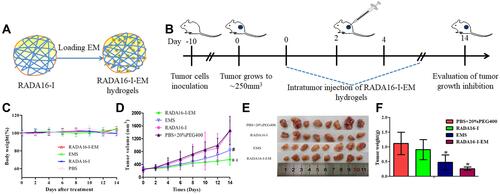
Figure 9 Anti-tumor activity in xenograft models in vivo. (A) H&E, (B) TUNEL and (D) Ki-67 staining on tumor sections collected from Hepa1-6 tumor-bearing mice after various treatments, (C and E) represent the expression of TUNEL-positive cells and Ki67-positive cells, respectively. Data are expressed as the mean ± SD, n=4 for each group. **P < 0.01, EMS group and RADA16-I-EM group vs Control group, RADA16-I-EM group vs EMS group. The red arrows “↗” in figures (B and D) represent tumor cell apoptosis and proliferation, respectively.
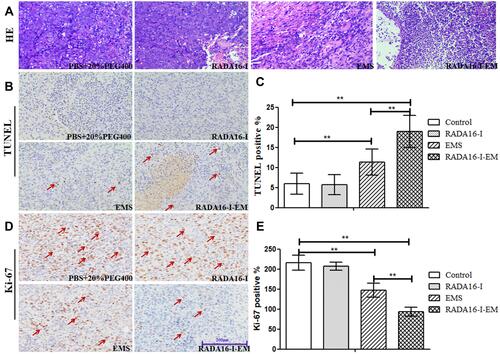
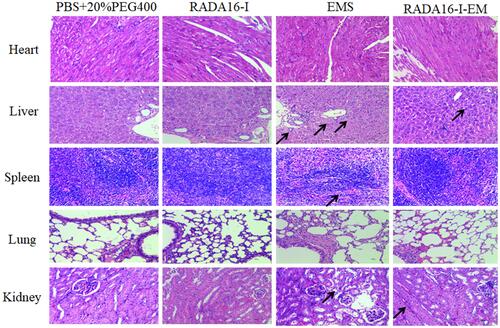
Figure 10 H&E staining of main organs (heart, liver, spleen, lungs, and kidneys) from Hepa1-6 tumor-bearing mice on the 14th day of treatment. “↗” represents the toxic site of the organs tissue during the drug EM administration.