Figures & data
Table 1 Water Solubility, Yield, Encapsulation Efficiency, Particle Size, and PI of PTS and Its Nanoparticle Formulation
Figure 1 Transmission electron microscopy (TEM) image of PSN (A), scanning electron microscopy (SEM) images of raw PTS (B) and PSN (C).
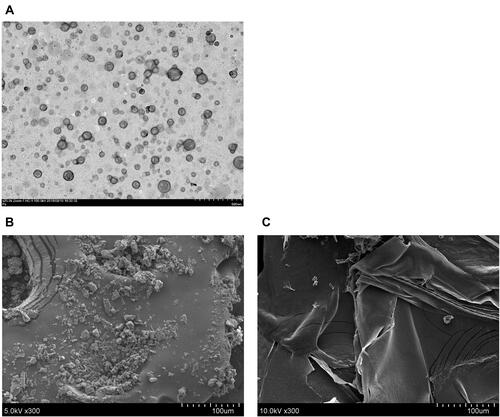
Figure 2 In vitro drug release profiles of raw PTS and PSN in two phosphate buffer solutions.
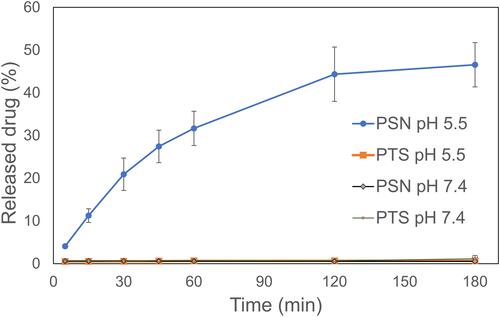
Figure 3 Crystalline and amorphous transformation using powder XRD analysis. The ratio represents the content of PTS:EE:PVA in PSN and the Blank represents only EE and PVA.
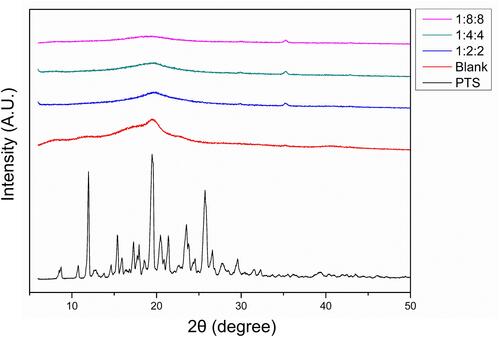
Figure 4 Analysis of hydrogen bonding interactions. FT-IR (A) and 1H NMR (B–F); (B) nanoparticle carrier, (C) PTS, (D) PSN1:2:2, (E) PSN1:4:4, (F) PSN1:8:8. The direction of the arrows represents the position of the hydrogen bond between PTS and EE-PVA.
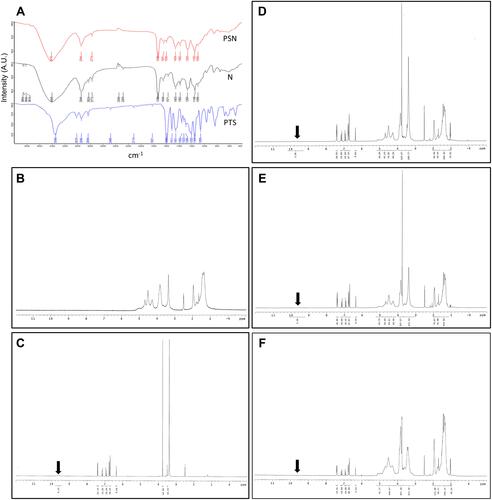
Table 2 400 MHz 1H Chemical Shift (δ, ppm) of PTS Protons in Raw State and Chemical Shift Displacements (Δδ, ppm) of PTS Prepared by EE and PVA
Figure 5 Chemical structure of pterostilbene.
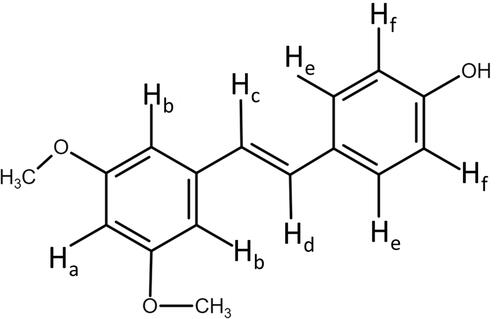
Figure 6 Expression of HIF-1α protein at different time points after hypoxia, and viability of HepG2 cells treated with PTS and PSN for 24 h. Viability of HepG2 cells and expression of HIF-1α protein (A). Cell viability following treatment with PTS (B) and PSN (C) under all hypoxia conditions. n = 3 of each group; *P < 0.05 compared with control.
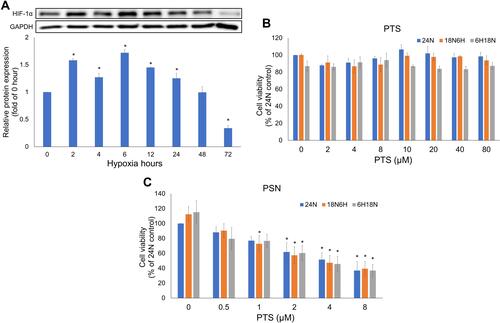
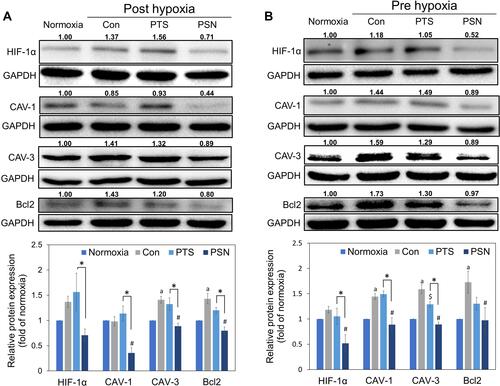
Figure 7 Expression of hypoxia-induced and antiapoptotic proteins post-hypoxia (A) and pre-hypoxia (B). Protein was collected after treatment of HepG2 cells with 40 μM PTS or PSN containing 4 μM PTS. Protein expression was determined by Western blotting. Columns represent mean ± standard deviation (n = 3). P < 0.05: aNormoxia compared with control; $PTS compared with control; #PSN compared with control; *PTS compared with PSN.