Figures & data
Figure 1 Gating strategy for the analysis of CNVs by FCM. 2D-plot of typical CNV isolates, prepared from blood plasma of a donor before (A) and after (B) the marathon. Gating of the CNVs and residual cells (RCs) was as indicated. The total number of events in the CNVs gate were taken.
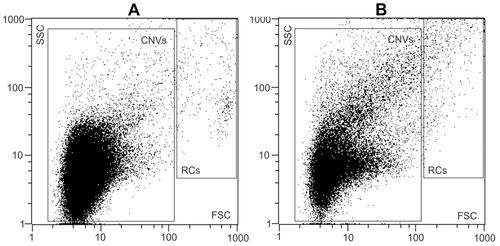
Figure 2 Scanning electron micrograph of a typical isolate of CNVs from the blood plasma sample with characteristic shapes of particles without internal structures including spheres, tubules (black arrows), and tori (white arrows). No residual cells are observed in the figure.
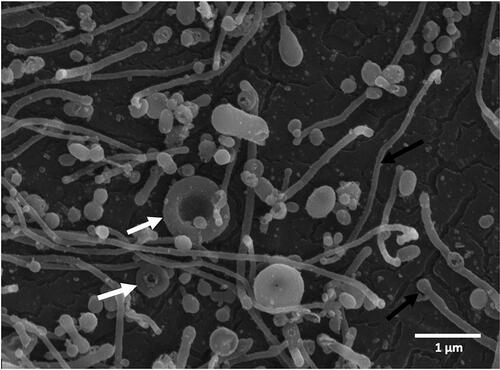
Table 1 Correlation Between Hematological and Biochemical Parameters, Microparticles and Running Distance More Than 15 Hours After Physical Activity
Table 2 Average Values of Lipidogram Parameters and Blood Cell Counts in Blood Samples Taken More Than 15 Hours After Physical Effort
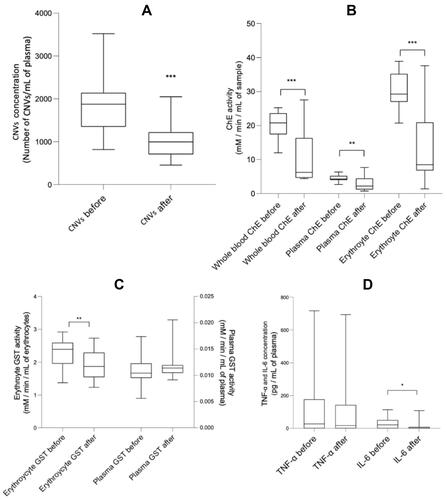
Figure 3 The effect of physical effort on concentration of microparticles and measured physiological state-related parameters in blood. (A) CNVs concentration in 1 mL plasma samples two days before and >15 hours after physical effort. (B) Activity of ChE (n=24) (in mM/min/mL of sample) two days before and >15 hours after physical effort in plasma, erythrocyte suspension and whole blood samples. (C) Activity of GST (n=24) (in mM/min/mL of sample) in plasma and erythrocyte suspension samples two days before and >15 hours after physical effort. Scale on the left represents values of plasma GST activity and scale on the right represents values of erythrocyte suspension GST activity. (D) Concentration of IL-6 and TNF-α (n=26) (in pg/mL of plasma) two days before and >15 hours after physical effort. Statistical differences before and after physical effort at: * p<0.05, ** p<0.01 and *** p<0.001.