Figures & data
Figure 1 (A) Scheme for the in vitro study. (B) Scheme for the in vivo study. (C) Fabrication of sheet–scaffold constructs. (D) The constructs were implanted into the dorsa of nude mice at 1 week.
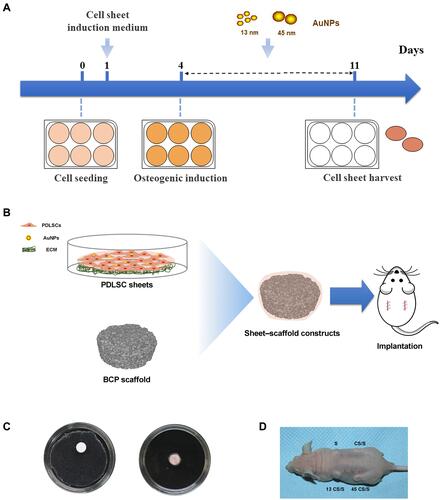
Figure 2 Characterization and osteogenic differentiation of AuNP (13 nm and 45 nm)-treated and control PDLSC sheets. (A) PDLSC sheets of different groups. (B) Representative images of HE staining and quantification. (C) ALP, alizarin red S, and von Kossa staining and quantification. *p<0.05, **p<0.01.
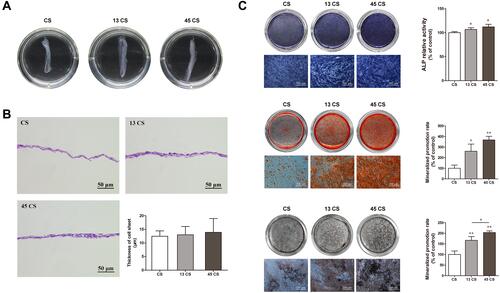
Figure 3 Osteogenic protein expression in PDLSC sheets. (A) Western blot of Runx2, ALP, COL1, and OPN and quantification. (B) Immunofluorescent analysis of Runx2 and ALP expression and quantification. *p<0.05, **p<0.01.
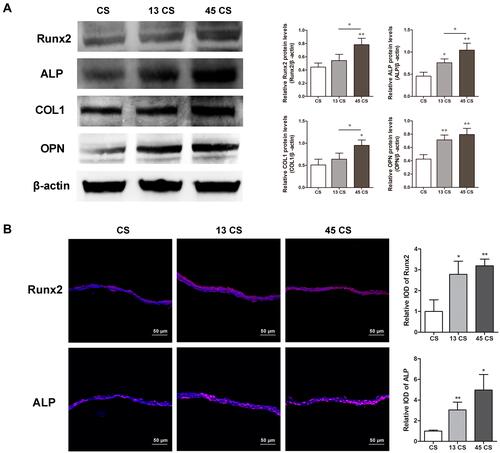
Figure 4 Effects of 13-nm and 45-nm AuNPs on autophagy of PDLSC sheets. (A) Western blot of LC3, p62, and quantification. (B) TEM images; arrows indicate internalized AuNPs, and the white “*”Indicates autophagosomes. *p<0.05, **p<0.01.
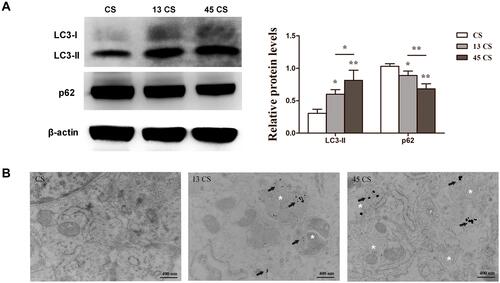
Figure 5 Bone formation of PDLSC sheet/BCP constructs in vivo 8 weeks post-surgery. (A) Representative images of micro-CT. (B) HE staining. (C) Goldner’s trichrome, toluidine blue, and Masson staining.
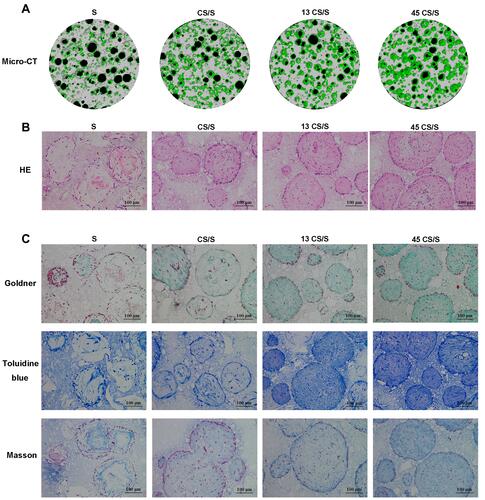
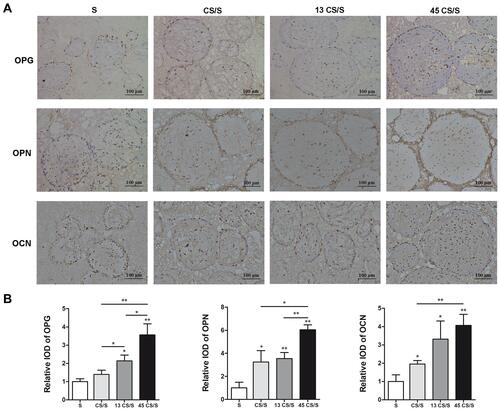
Figure 6 IHC staining of OPG, OPN, and OCN (A) and quantification (B) at 8 weeks. *p<0.05, **p<0.01.