Figures & data
Figure 1 Structures of the fluorescent dyes used as probes for nanoparticle surface properties.

Table 1 Optical characteristics of fluorescent dyes used to test maghemite nanoparticle surface properties
Figure 2 FTIR spectra of bare maghemite nanoparticles, rhodamine B isothiocyanate and SAMN–RITC complex. Samples were lyophilized, homogenized with KBr powder, and pelleted by an 8.0 ton hydraulic press. (—) SAMN, (---) RITC; (········) SAMN–RITC. Inset: Comparison of FTIR spectra of RITC and SAMN–RITC complex in the region 1365–1000 cm−1. (—), RITC; (········), SAMN–RITC.
Abbreviations: SAMN, surface-active maghemite nanoparticles; RITC, rhodamine B isothiocyanate; KBr, potassium bromide; FTIR, Fourier-transform infrared.
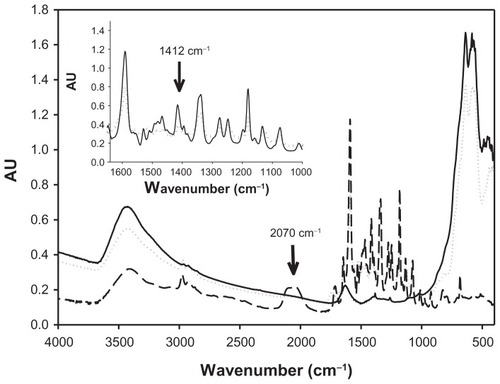
Figure 3 RITC binding to maghemite nanoparticle surface as a function of pH.
Note: Experiments were carried out in 50 mM tetramethylammonium perchlorate in the presence of 10 μM RITC and 100 mg L−1 SAMN, measuring the decrease of solution absorbance at 554 nm.
Abbreviations: SAMN, surface-active maghemite nanoparticles; RITC, rhodamine B isothiocyanate.
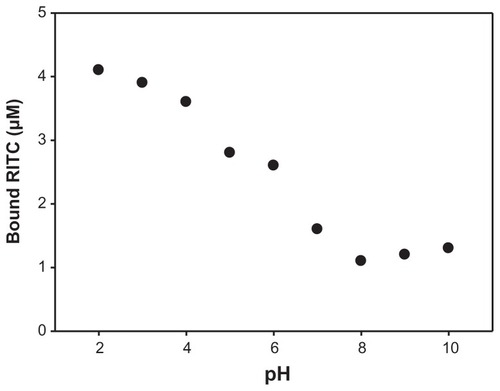
Table 2 Binding of RITC derivatives to bare maghemite nanoparticles
Figure 4 TEM image of maghemite nanoparticles derivatized with RITC and with immobilized BSAO (SAMN–RITC–BSAO).
Abbreviations: BSAO, bovine serum copper-containing amine oxidase; SAMN, surface-active maghemite nanoparticles; RITC, rhodamine B isothiocyanate; TEM, transmission electron microscopy.
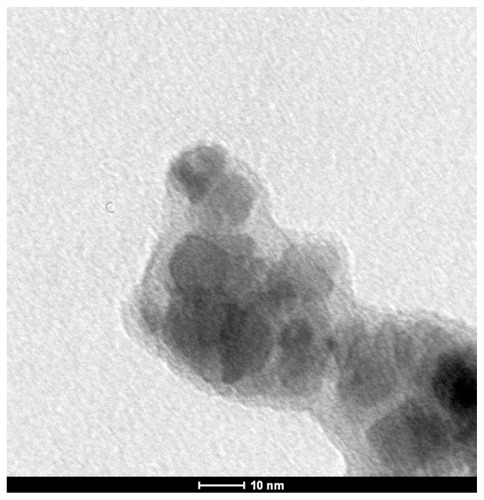
Table 3 The ten most abundant 10 common peptides obtained after trypsin digestion of native and SAMN bound BSAO
Figure 5 Amino acid sequence coverage of native and bound BSAO.
Notes: Bold letters indicate amino acid total sequence coverage (42%) obtained after trypsin digestion and analysis by MS/MS mass spectrometry of nanoparticle-bound BSAO. Underscore, bold letters indicate the amino acid sequences that were used for relative quantification of nanoparticle-bound BSAO.
Abbreviations: BSAO, bovine serum copper-containing amine oxidase; MS/MS, tandem mass spectroscopy.
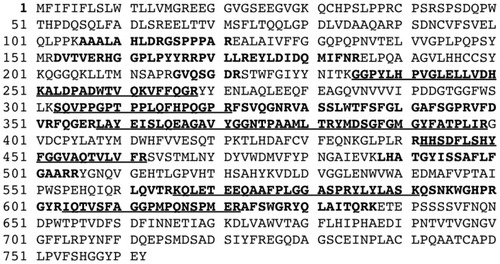
Table 4 Kinetic parameters of native and SAMN-bound BSAO