Figures & data
Figure 1 Chemical structure of sildenafil and its electrospray ionization mass spectrometry/mass spectrometry fragmentations.
Note: *Protonation site.
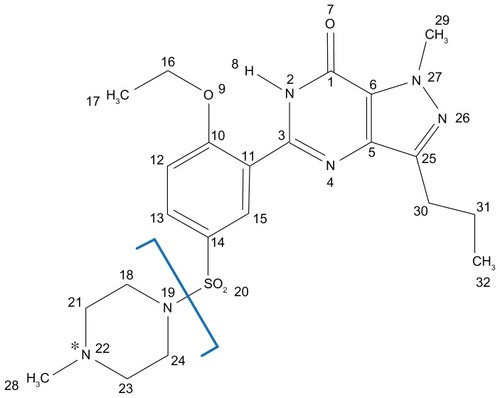
Figure 2 Powder X-ray diffraction patterns of (A) sildenafil citrate, (B) montmorillonite (MMT), (C) sildenafil–montmorillonite (SDN–MMT), and (D) polyvinylacetal diethylaminoacetate (AEA)-coated SDN–MMT.
Note: *Quartz.
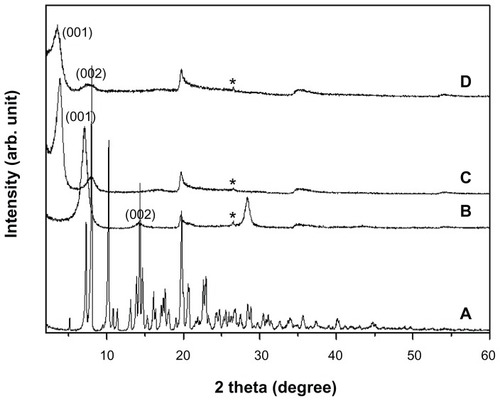
Figure 3 Schematic descriptions for (A) sildenafil–montmorillonite (SDN–MMT) and (B) sildenafil (SDN) molecules drawn by ChemBio3D Ultra 12.0 program (Cambridge Soft, Cambridge, MA).
Notes: carbon, gray; nitrogen, blue; oxygen, red; sulfur, yellow; hydrogen, white.
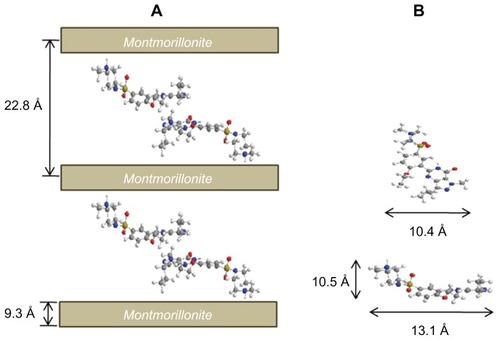
Figure 4 Thermogravimetric curves of (A) sildenafil citrate, (B) sildenafil– montmorillonite (SDN–MMT), and (C) montmorillonite (MMT).
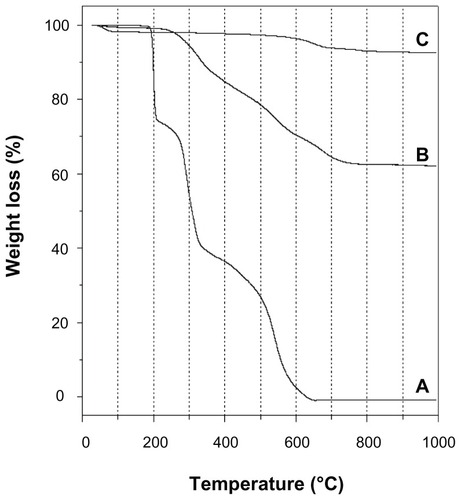
Table 1 In vitro drug dissolution profiles under a simulated buccal condition
Figure 5 Release profiles of sildenafil from (A) sildenafil–montmorillonite (SDN–MMT), (B) polyvinylacetal diethylaminoacetate (AEA)-coated SDN–MMT, (C) Viagra®, and (D) sildenafil citrate.
Note: The release experiments were performed at pH = 1.2.
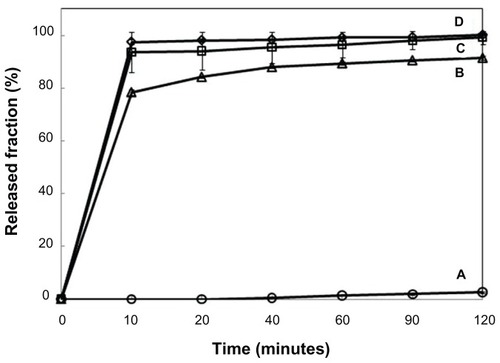
Table 2 Pharmacokinetic parameters of SDN after oral administration of Viagra® and AEA-coated nanohybrids to the beagle dogs
Figure 6 Mean plasma concentration–time curves of sildenafil after oral administration of Viagra® (●) and polyvinylacetal diethylaminoacetate (AEA)-coated hybrid (○) to the beagle dogs.
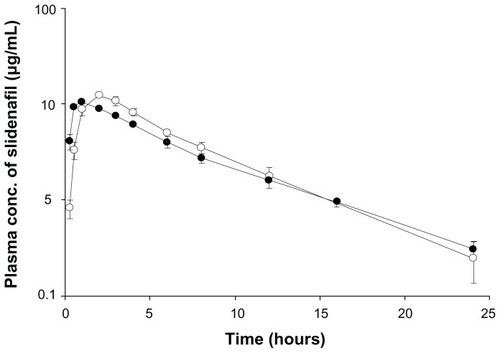
Table 3 Fraction of nondegraded SDN content in the nanohybrids after incubation under an accelerated stability test condition (40°C, 75% RH)
Table S1 Accuracy and precision of SDN analyses in plasma samples
Table S2 Recovery of SDN spiked into plasma samples
Table S3 In vitro drug dissolution profiles under a simulated buccal and gastric fluid condition
Table S4 Release profiles of sildenafil from (A) SDN–MMT, (B) AEA-coated SDN–MMT, (C) Viagra®, and (D) sildenafil citrate. The release experiments were performed at pH = 1.2
Figure S1 Fourier transform infrared spectra of (A) sildenafil citrate, (B) montmorillonite (MMT), (C) sildenafil–montmorillonite (SDN–MMT), and (D) polyvinylacetal diethylaminoacetate (AEA)-coated SDN–MMT.
Notes: The circles (●) and the dashed vertical lines show the characteristic peaks seen with intact SDN and MMT.
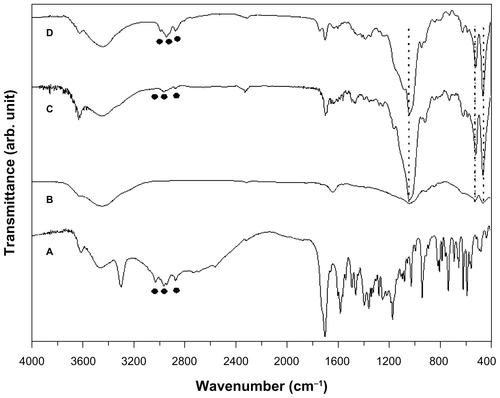
Figure S2 The particle size distribution of (A) sildenafil–montmorillonite (SDN–MMT) and (B) polyvinylacetal diethylaminoacetate (AEA)-coated SDN–MMT.
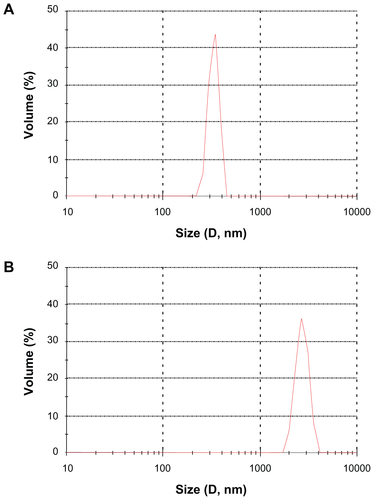
Figure S3 Typical electrospray ionization mass spectrometry/mass spectrometry spectra of authentic sildenafil.
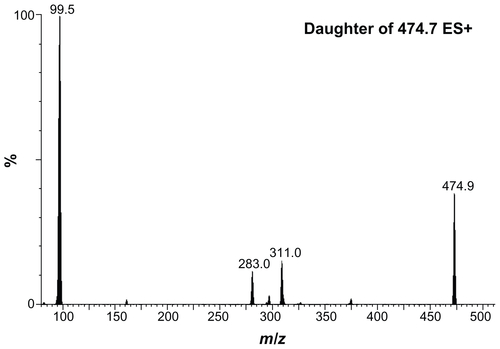
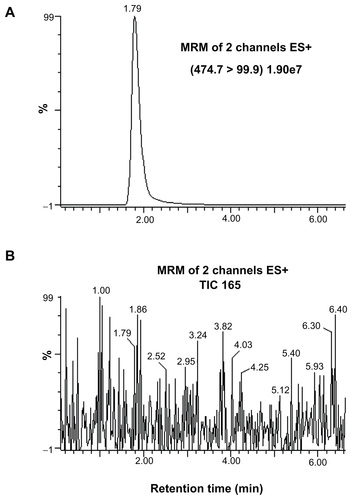
Figure S4 Representative chromatograms of (A) sildenafil detected in a plasma sample collected for 2 hours after sildenafil administration, and (B) blank plasma sample collected just before sildenafil administration.
Abbreviations: ES, electrospray; MRM, multiple reaction monitoring; TIC, total ion count.