Figures & data
Figure 1 Schematic illustration of the Se-CQDs preparation for the treatment of TSCI. Water-soluble Se-CQDs were prepared by hydrothermal treatment of L-selenocystine. After intraspinal injection, the Se-CQDs efficiently scavenged ROS, consequently reducing inflammation, preventing neuronal apoptosis and demyelination, thereby improving the recovery of locomotor function of rats with TSCI.
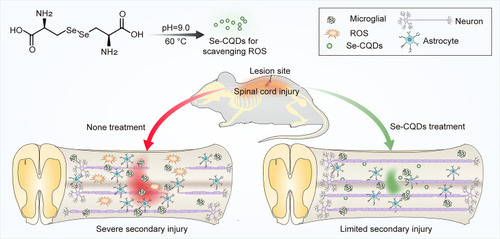
Figure 2 Characterization of Se-CQDs. (A) Particle size of the Se-CQDs, as measured by DLS. (B) TEM image of Se-CQDs. (C) XPS spectrum of Se-CQDs.
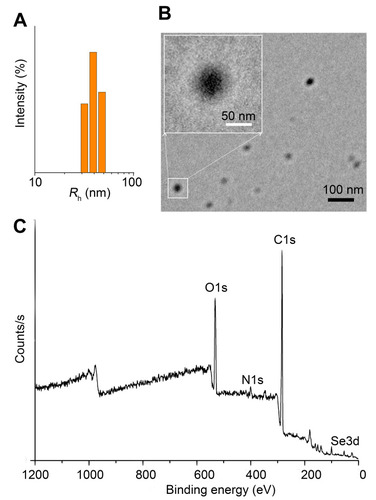
Figure 3 Se-CQDs scavenge ROS to protect astrocytes from ROS-induced oxidative damage. (A) Effect of H2O2 on the viability of astrocytes. (B) Protective effect of Se-CQDs against H2O2-induced oxidative damage in astrocytes. The concentration of H2O2 was 250 μM. (C) Intracellular ROS levels in astrocytes were measured by DCF staining. (D) Quantitative analysis of the fluorescence intensity of DCF in , ** P < 0.01, when + Se-CQDs group compared with H2O2 group. (E) Live/dead straining of astrocytes under different conditions, scale bar = 20 μm. (F) Quantitative analysis of the number of dead cells in , ** P < 0.01, when + Se-CQDs group compared with H2O2 group.
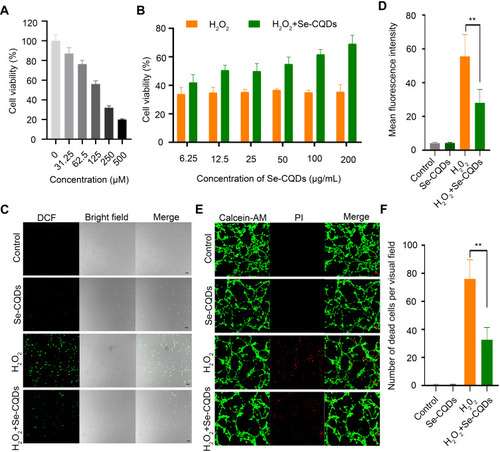
Figure 4 Assessment of locomotor functional recovery following traumatic spinal cord injury (TSCI). (A) BBB scores of rats with TSCI treated with saline, 2.5 μg Se-CQDs, or 10 μg Se-CQDs. ** P < 0.01, in comparison with the saline group. (B) Typical images of the foot in rats with TSCI after treatment with saline, 2.5 μg Se-CQDs, or 10 μg Se-CQDs. The asterisk * indicates the hindlimb walking patterns. (C) Typical images of spinal cords collected from rats in the saline, 2.5 μg Se-CQDs, or 10 μg Se-CQDs treated groups at 8 weeks post-injury. The red circles indicate the lesion sites. (D) Recovery of the urination time of rats with TSCI after treatment with saline, 2.5 μg Se-CQDs, or 10 μg Se-CQDs ** P < 0.01, when + Se-CQDs group was compared with saline group. (E) H&E staining of bladders shown at 2× (left) and 20× magnification (right), and the followed two images show the magnified views of the fields marked by the blue squares, arrows and triangles indicated the pathological characteristics. (F) Masson staining of bladders shown at 2× (left) and 20× magnification (right). In the , the two images on the right are the magnified views of the fields marked by the blue squares in the leftmost image; arrows and triangles indicated the hyperplasia and fibrosis characteristics of bladder, respectively. The scale bars are 500 μm and 50 μm for the images obtained at 2× and 20× magnification, respectively.
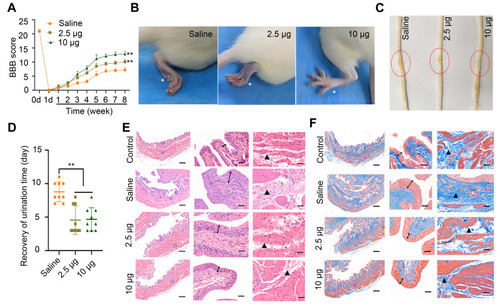
Figure 5 Histomorphological changes at 8 weeks post-injury in vivo. (A) Images of spinal cord tissue after staining with H&E, shown at 2X (left, scale bar = 500 μm) and 20 X magnification (right, scale bar = 50 μm). The images on the right are the corresponding enlarged views of the areas indicated by blue squares in the left images. The red lines indicate the edge of the lesion sites. (B) LFB staining of myelin sheaths is shown at 2X (left, scale bar = 500 μm) and 20X magnification (right, scale bar = 50 μm). The images on the right are the corresponding enlarged views of the areas indicated by blue squares in the left images. The red lines indicate the edge of the lesion sites. (C) Representative TEM images showing the ultrastructure of myelin sheaths in different groups. Scale bar = 5 μm. (D) Double-staining of the slices with anti-NF200 and anti-NeuN antibodies. Scale bar = 50 μm. (E) Quantitative analysis of mean fluorescence intensity of NF200 staining in Figure 4D, * P< 0.05, in comparison with saline group. (F) Quantitative analysis of mean fluorescence intensity of NeuN staining in Figure 4D. * P < 0.05 and ** P < 0.01, in comparison with saline group.
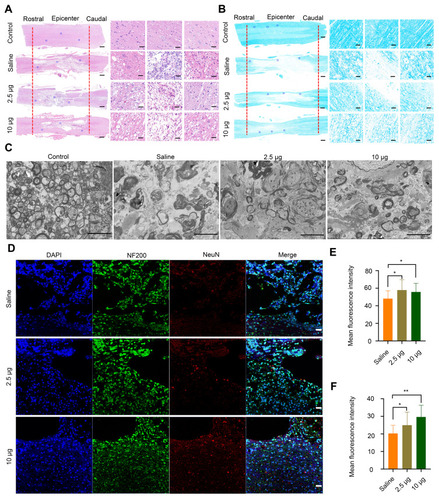
Figure 6 Immunofluorescence images showing the mechanism underlying the Se-CQDs-mediated promotion of behavioral functional recovery. (A) Immunofluorescence images highlighting the anti-inflammatory properties of Se-CQDs. Scale bar = 50 μm. (B) Immunofluorescence images showing the inhibition of glial scars. Scale bar = 50 μm.
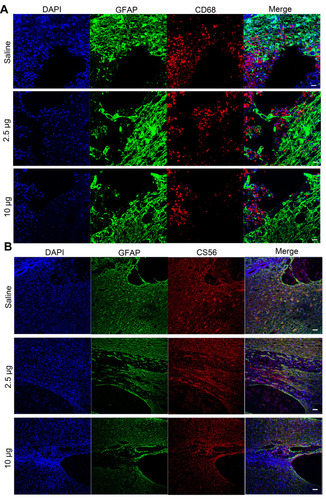
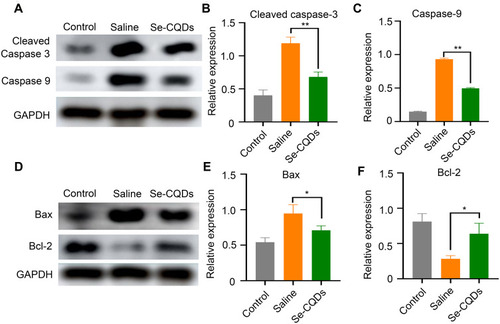
Figure 7 Anti-apoptotic effects of Se-CQDs. (A) Western blot analysis of cleaved caspase-3 and caspase-9 protein levels in the injured spinal cord tissues from different groups. (B) Semi-quantitative analysis of cleaved caspase-3 protein levels based on the data in , ** P < 0.01, in comparison with the saline group. (C) Semi-quantitative analysis of caspase-9 protein levels based on the data in , ** P < 0.01, in comparison with the saline group. (D) Western blot analysis of Bax and Bcl-2 protein levels. (E) Semi-quantitative analysis of Bax protein levels based on the data in , * P < 0.05, in comparison with the saline group. (F) Semi-quantitative analysis of Bcl-2 protein levels based on the data in , * P < 0.05, in comparison with the saline group. Data are expressed as the mean ± SD; n = 3.