Figures & data
Figure 1 Flow chart of the whole workflow of EV separation and analysis.
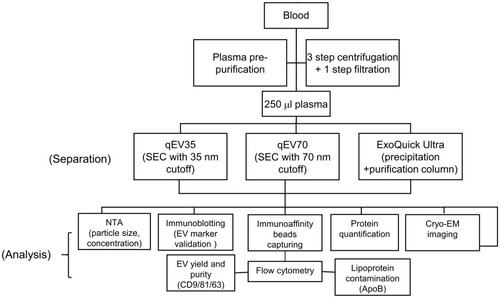
Figure 2 Particle size distribution and concentration of samples separated using three kits from both PCa patients (n=6) and HC (n=6). (A) Particle size distributions between qEV35 and qEV70 were similar in the range <130 nm, while qEV70 started to collect a larger portion of particles >130 nm. ExoQuick Ultra has an obvious peak shift to the larger size range. The histograms are presented as the average from 12 samples (solid curves) with standard error (vertical red error bar); (B) Percentage of total particles falls into 4 different size fractions: <100 nm, 100–150 nm, 150–200 nm, >200 nm. Particles from 100–150 nm have the largest portion for all three kits. qEV35 collected the highest portion of particles in the ≤ 100nm range. (C) Particle mode sizes: Exoquick Ultra 141.9 ± 12.5 nm, qEV35 120.6 ± 14.9 nm, and qEV70 127.7 ± 10.4 nm. The mode size from ExoQuick Ultra samples was significantly larger than those from the two SEC kits. No significant difference was found between qEV35 and qEV70 kits. (D) Particle concentrations calculated into per mL plasma. The number of particles was significantly lower (10 orders of magnitude lower) in qEV70 compared to qEV35 and ExoQuick Ultra. No significant difference between ExoQuick Ultra and qEV70. *P < 0.05, **P < 0.01, ***P < 0.001, ****P < 0.0001. One-way ANOVA with post hoc multiple comparison correction was used for c-d.
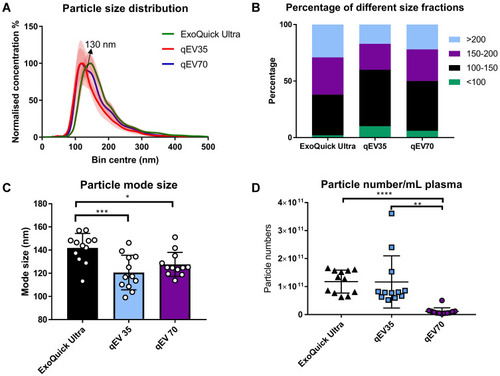
Figure 3 Representatives of immunoaffinity blotting for typical EV marker expression (12.5 μg protein loading). The EV samples from PCa patients showed the presence of CD81, TSG101 markers and absence of Calnexin (CANX) marker. Blank: assay running with PBS instead of sample. The red dotted boxes highlighted the location of individual blots.
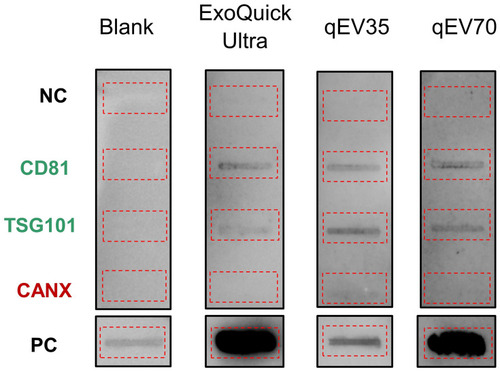
Figure 4 Representative Cryo-EM images showing different EV structures from the same PCa patient using the three kits. Samples from all three kits contain EVs (yellow and red arrows) with heterogenous structures such as single vesicles (A, D, G), double vesicles (A and H), multilayer vesicles (B and E) and incomplete vesicles (I). There are large numbers of electron-dense particles in the background (C–I) which are assumed to be lipoproteins in the background for samples from all three kits (white arrows). Scale bar: 200 nm. The multilayer-vesicle structure in (B) pointed by red arrow was characterised by 3D cryo-EM to exclude the possibility of overlapped EVs (Supplementary Video).
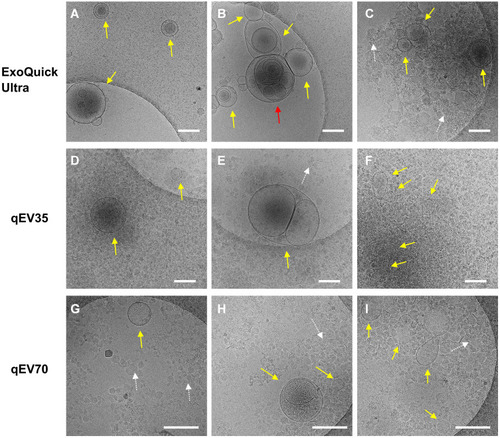
Figure 5 EV quality assessment from both PCa patients and HC samples from three different kits. (A) Schematic diagram of EVs capturing by immunomagnetic beads. Right: Scanning electron microscopy images of the EV binding on CD9 bead and negligible non-specific binding on IgG control bead. Scale bar: 500 nm. (B) Significant higher CD9/81/63 signals were detected in samples from qEV35 and ExoQuick Ultra compared to qEV70, suggesting a significantly higher EV yield. The EV yields from qEV35 and ExoQuick Ultra have no significant difference. (C) qEV70 provides a higher EV purity than the other two kits, while ExoQuick Ultra provided the lowest EV purity. (D and E) qEV70 provides the lowest lipoprotein contamination and Lipoprotein/EV ratio. (F) Protein contamination from ExoQuick Ultra is 4 times of that from qEV35 and 33 times of that from qEV70. (G) Particle/protein ratio shows ExoQuick Ultra provides the lowest purity. Sample number: n=12 for (B, D, E) (from 6 patients and 6 HC); n=6 for (C, F, G) (from 3 patients and 3 HC). *P < 0.05, **P < 0.01, ***P < 0.001, ****P < 0.0001. One-way ANOVA with post hoc multiple comparison correction was used for (B–F).
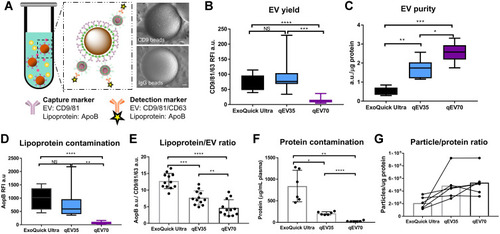
Figure 6 (A–C) Correlation between particles number and EV yield (from 6 patients and 6 HC). Strong positive correlations were observed for all the separation kits. (A) ExoQuick Ultra: R2=0.9186, P<0.0001; (B) qEV35: R2=0.9557, P<0.0001; (C) qEV70: R2=0.8774, P<0.0001. (D–F) Correlation of particles number to the protein amount (from 3 patients and 3 HC). Only qEV70 provided a strong correlation. (D) ExoQuick Ultra: R2=0.03332, P=0.7292; (E) qEV35: R2=0.4067, P=0.1731; (F) qEV70: R2=0.9875, P<0.0001.
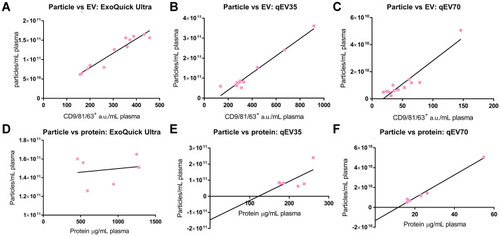
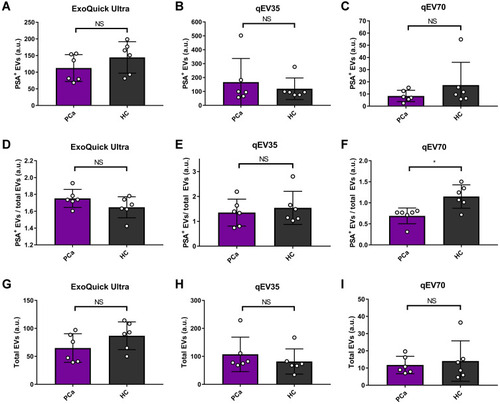
Figure 7 Comparison between PCa patients (n=6) and health control (n=6) using different EV metrics with three different kits. (A–C) PSA positive EVs, (D–F) PSA positive EVs/total EVs, and (G–I) Total EVs. No significant difference was observed between PCa patients and healthy controls (HC) based on PSA-specific EVs or total EVs for all the three methods. Only qEV70 shows some difference between PCa patients and HC when using PSA positive EVs/total EVs as the metrics. As different fluorescence stains in the detection marker were used for PSA and EVs (Alexa Fluor 405 for PSA and APC for EVs), the fluorescence signals from PSA is more intensive than EVs, which leads to the RFI ratio of PSA+ EV/total EV >1. *P < 0.05. Two-tail t-test was used for (A–I).