Figures & data
Figure 1 Gold nanorods and internalization by human melanoma A375 cells. (A and B) Nanoparticles shown at different magnifications as viewed by transmission electron microscopy. The gold nanorods were coated with an approximately 31 nm silica layer. (C and D) A375 melanoma cell shows evidence of internalized RGD-GNRs. Gold nanorods were internalized into cells by endocytosis at the cell membrane, and mainly distributed in cytoplasm.
Abbreviations: GNR, gold nanorod; RGD-GNRs, arginine-glycine-aspartate-conjugated gold nanorods.
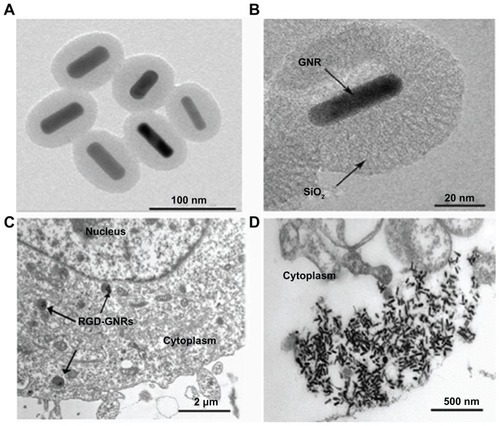
Figure 2 Effects of RGD-GNRs and gold nanorods on cell viability. A375 cells were seeded in 96-well culture plates and incubated in the absence (control) or the presence of the indicated concentrations of gold nanorods or RGD-GNRs for 48 hours (A), or A375 cells were treated with RGD-GNRs or gold nanorods at concentrations of 50 μg/mL for variable times (B). Cell viability was measured by MTT assay and analyzed using an enzyme-labeling analyzer.
Notes: Data were compared with the control group (normalized 1.0) and data points represent the mean survival fraction of three independent experiments done in triplicate; error bars represent the standard deviation.
Abbreviations: GNR, gold nanorod; RGD-GNRs, arginine-glycine-aspartate-conjugated gold nanorods.
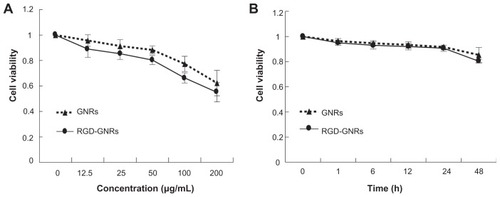
Figure 3 Radiosensitizing effect of gold nanorods or RGD-conjugated gold nanorods. A375 cells were treated with either gold nanorods (50 μg/mL) or RGD-GNRs (50 μg/mL) for one hour prior to indicated irradiation. Cells were trypsinized, counted, and seeded at different dilutions. Colonies of >50 cells were counted approximately 2 weeks after treatment.
Notes: The clonogenic surviving fractions were generated with each point representing the mean surviving fraction calculated from three independent experiments done in triplicate for each treatment condition; error bars represent the standard deviation.
Abbreviations: GNR, gold nanorod; RGD-GNRs, arginine-glycine-aspartate-conjugated gold nanorods; RT, radiotherapy.
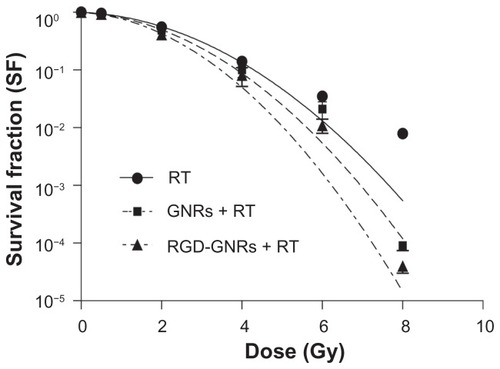
Figure 4 Enhancement of radiation-induced apoptosis by RGD-GNRs. A375 cells were treated with either gold nanorods or RGD-GNRs for one hour prior to irradiation. The cells were stained with Annexin V and propidium iodide, and apoptosis was analyzed by flow cytometry after 24 hours of treatment. (A–C) Apoptosis in control cells and the cells containing gold nanorods (50 μg/mL for 24 hours) or RGD-GNRs (50 μg/mL for 24 hours) without radiation. (D–F) Apoptosis in radiation alone cells and cells containing gold nanorods or RGD-GNRs plus radiation (6 mV x-rays at a dose of 4 Gy). (G) Data from (A–F) were quantified and are presented as the mean ± standard deviation (n = 3 experiments).
Notes: *P < 0.05 compared with control group; **P < 0.05 compared with other treated groups.
Abbreviations: Ctr, Control Group; GNR, gold nanorod; PI, propidium iodide; RGD-GNRs, arginine-glycine-aspartate-conjugated gold nanorods; RT, radiotherapy.
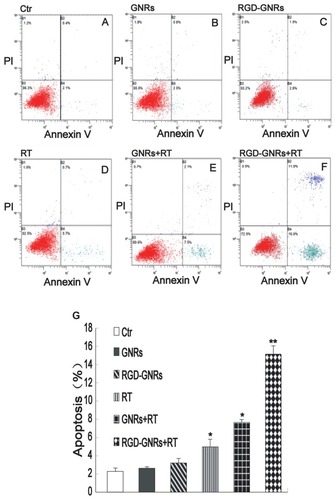
Figure 5 Enhancement of radiation-induced G2/M cell cycle arrest by RGD-GNRs in A375 cells. A375 cells were incubated with either Dulbecco’s Modified Eagle Medium (controls), gold nanorods (50 μg/mL) for one hour, or RGD-GNRs (50 μg/mL) for one hour without or with irradiation (6 mV x-rays with a dose of 4 Gy), and then the cells were stained with propidium iodide, and analyzed by flow cytometry 24 hours after radiation. (A) Percentage in different cell phases. Histograms represent the mean ± standard deviation (n = 3 experiments). (B) Flow cytometry analysis for the different treatment groups.
Notes: *P < 0.05 compared with the control group; **P < 0.05 compared with radiotherapy alone group.
Abbreviations: Ctr, Control Group; GNR, gold nanorod; RGD-GNRs, arginine-glycine-aspartate-conjugated gold nanorods; RT, radiotherapy.
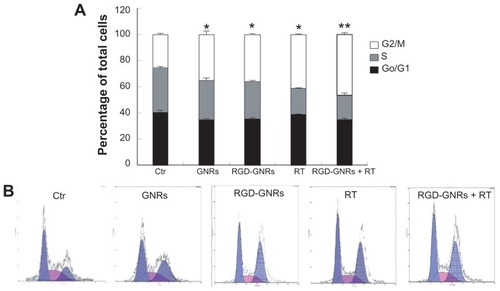
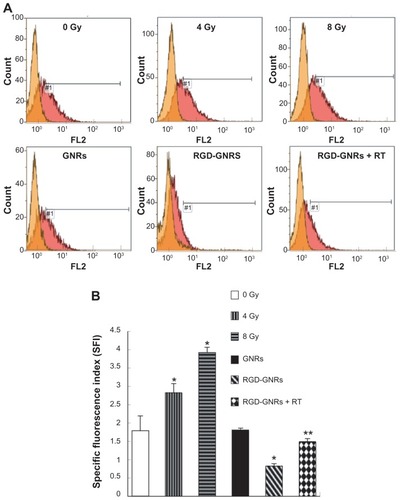
Figure 6 Changes in integrin αvβ3 expression level. (A) A375 cells were treated with either radiation, gold nanorods (50 μg/mL) for one hour, or RGD-GNRs (50 μg/mL) for one hour without or with irradiation, and then the cells were stained with anti-integrin αvβ3 antibody LM609 or isotype-matched control antibody DD7 24 hours after treatment and αvβ3 expression was measured by flow cytometry. (B) αvβ3 expression was quantified with specific fluorescence intensity; experiments were done in triplicates. Columns, mean from three repeated experiments; bars, standard deviation.
Notes: *P < 0.05 compared with control group; **P < 0.05 compared with radiotherapy alone group.
Abbreviations: GNR, gold nanorod; RGD-GNRs, arginine-glycine-aspartate-conjugated gold nanorods; RT, radiotherapy.