Figures & data
Scheme 1 Schematic illustration depicting starvation therapy in reversing cancer drug-resistance detected by fluorescent dextran nanoparticles (FDNPs) assay.
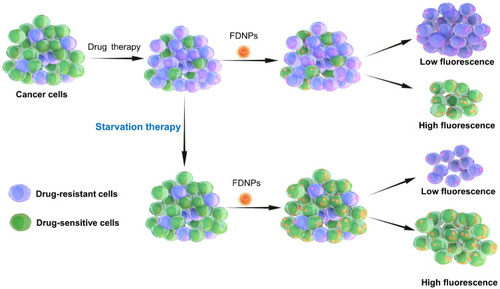
Figure 1 Fabrication and characterization of fluorescent dextran nanoparticles (FDNPs). (A), Schematic illustration depicting the fabrication of FDNPs and the application in starvation therapy. (B), Transmission electron microscope (TEM) image of FDNPs (negatively stained by phosphotungstic acid). (C), Diameter distribution of FDNPs detected by dynamic light scattering (DLS). (D), Fluorescence spectrum of FDNPs at a concentration of 10 µg/mL. (E–H), Flow cytometry data for OV, DROV, K562, DRK562 cells after they had been cultured with FGNPs for 4 h.
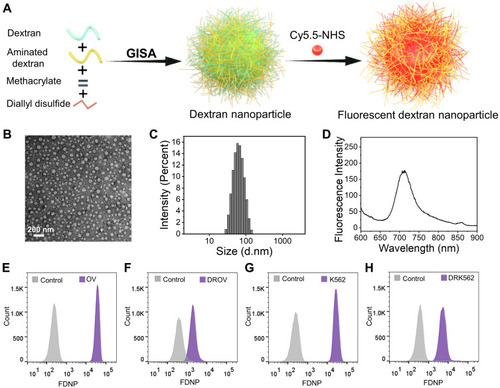
Figure 2 Detection of genetic differences among the chemoresistant and chemosensitive cancer cells. (A), MDR1 expression of OV and DROV cells as determined by qRT-PCR. (B), MDR1 expression of K562 and DRK562 cells as determined by qRT-PCR. (C), P-gp expression of OV, DROV, K562, and DRK562 cells as determined by Western blot assays. (D), Half-maximal inhibitory concentration (IC50) of OV and DROV cells. (E), IC50 of K562 and DRK562 cells. (F), Na+K+ and Ca++Mg++ ATPase vitality of OV and DROV cells. (G), Na+K+ and Ca++Mg++ ATPase vitality of K562 and DRK562 cells. (H), Expression of GLUT1 and glycolysis genes in OV and DROV cells as determined by qRT-PCR. (I), Expression of GLUT1 and glycolysis genes in K562 and DRK562 cells as determined by qRT-PCR. (J), GSEA revealing enrichment of oxidative phosphorylation gene signature in DROV cells compared to OV cells. (K), GSEA revealing enrichment of respiratory electron transport gene signature in DROV cells compared to OV cells.
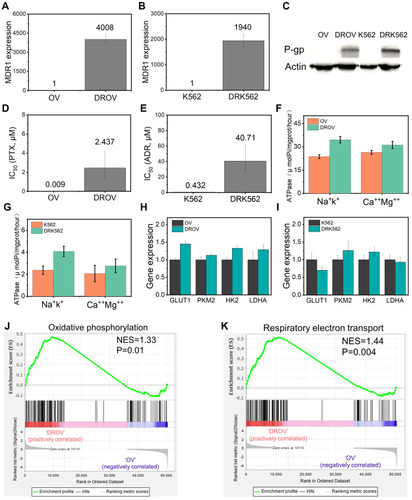
Figure 3 Detection of the difference in glucose consumption among the chemoresistant and chemosensitive cancer cells. (A), Cell viability of OV and DROV cells cultured at different glucose concentrations at 100%, 75%, 50%, 25% for 48h. (B), Cell viability of OV and DROV cells cultured in medium with 100% glucose concentration for 4, 24, 48, and 72 h. (C), Cell viability of OV and DROV cells cultured in medium with 50% glucose concentration for 4, 24, 48, and 72 h. (D), Cell viability of K562 and DRK562 cells cultured at different glucose concentrations at 100%, 75%, 50%, 25% for 48 h. (E), Cell viability of K562 and DRK562 cells cultured in medium with 100% glucose concentration for 4, 24, 48, and 72. (F), Cell viability of K562 and DRK562 cells cultured in medium with 50% glucose concentration for 4, 24, 48, and 72 h.
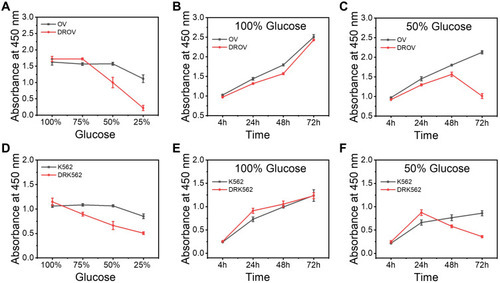
Figure 4 Reducing glucose in decreasing chemoresistant cancer cell proportion. (A–D), Flow cytometry data for DROV/OV mixed cells cultured at different glucose concentrations at 100%, 75%, 50%, 25% for 48 h, and subsequently incubated with FGNPs for 4 h. (E–H), Flow cytometry data for DRK562/K562 mixed cells cultured at different glucose concentrations at 100%, 75%, 50%, 25% for 48 h, and subsequently incubated with FGNPs for 4 h. (I), The chemoresistant cells proportion in DROV/OV and DRK562/K562 mixed cells after cells were cultured in medium with 50% glucose concentration for 4, 24, 48, and 72 h. (J–K), Laser confocal microscopy images of DROV/OV and DRK562/K562 mixed cells after cells were cultured in medium with 100% and 50% glucose concentration for 48 h.
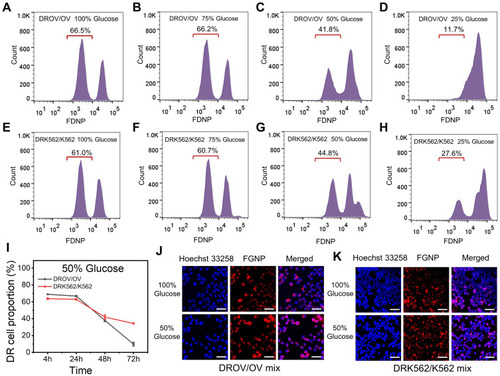
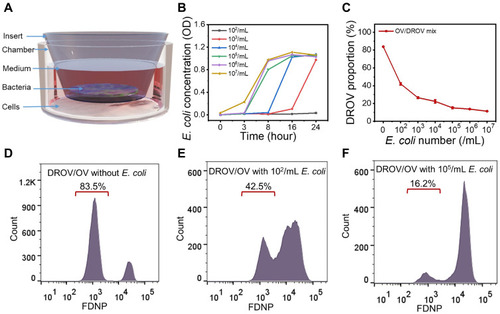
Figure 5 Application of E. coli in reversing cancer drug-resistance. (A), Schematic illustration depicting the co-culture of tumor cells with bacteria. (B), The growth curve of E. coli cultured in RPMI-1640 medium with different initial concentrations. (C), The DROV cells proportion in DROV/OV mixed cells after cells were co-cultured with different concentrations of E. coli for 24h. (D–F), The Flow cytometry data for DROV/OV mixed cells after cells were co-cultured with different concentrations of E. coli for 24h, following by culturing with FGNPs for 4 h. The E. coli number (/mL) in the graph is the initial number before culturing.