Figures & data
Figure 1 Nanoparticle synthesis. (A) Core/shell iron/iron oxide nanoparticles were synthesized and then coated in a dopamine based stealth ligand. (B–D) Transmission electron microscopic image of obtained particles showing bunched rods.
Abbreviations: Fe, iron; Fe3O4, iron oxide; THF, tetrahydrofuran.
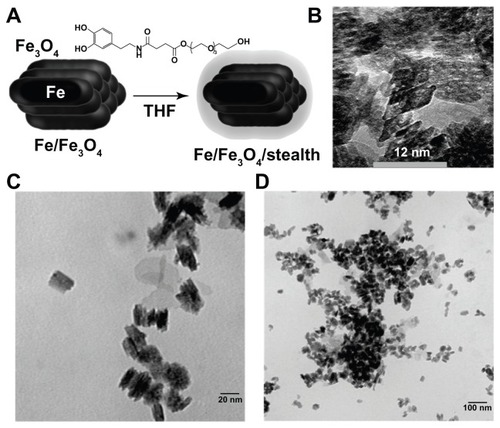
Figure 2 Treatment cycle for the in vivo study.
Abbreviations: AMF, alternating magnetic field; Mo/Ma, monocyte/macrophage-like cells.
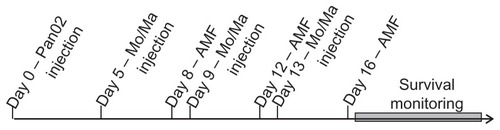
Figure 3 Nanoparticle loading. Monocyte/macrophage-like cells were cultured overnight in increasing concentrations of nanoparticles. The next morning cells were washed and assayed. (A) Toxicity of nanoparticles: cells were assayed for viability using 3-(4,5-Dimethylthiazol-2-yl)-2,5-diphenyltetrazolium bromide assay. (B) Loading of nanoparticles: cells were assayed for iron content using the ferrozine assay. (C) Percent of cells loaded: cells were assayed for increased side scatter using flow cytometry.
Note: Error bars are standard deviation. *= P < 0.05.
Abbreviations: ANOVA, analysis of variance; Fe, iron.
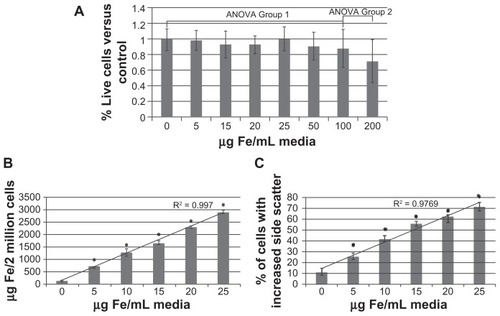
Figure 4 Monocyte/macrophage-like cells (Mo/Ma) only infiltrate Pan02 tumors. PKH26-labeled Mo/Ma were injected intraperitoneally into mice bearing intraperitoneal Pan02 tumors. (A)–(F) Mice were euthanized 3 days after Mo/Ma injection and organs were harvested and imaged for PKH26 (Mo/Ma). Representative images are shown. (A) Tumor 10×; (B) tumor 40×; (C) pancreas; (D) kidney; (E) liver; and (F) lung. (G–L) Mice were euthanized 6 days after Mo/Ma injection and organs were harvested and imaged for PKH26 (Mo/Ma). Representative images are shown. (G) Tumor (note healthy pancreas at the top left); (H) tumor; (I) pancreas; (J) kidney; (K) liver; and (L) lung.
Notes: Blue = Hoechst nuclear counterstain; red = PKH26 (Mo/Ma). All scale bars are 100 μm, objective is 20× unless otherwise specified.
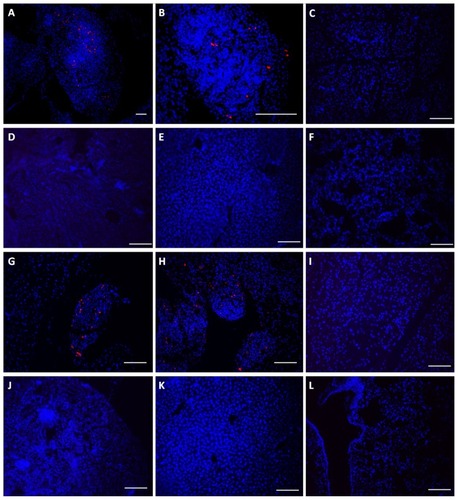
Figure 5 Monocyte/macrophage-like cells (Mo/Ma) infiltrate Pan02 tumors. (A and B) Mo/Ma loaded with PKH26 were injected into mice bearing intraperitoneal Pan02 tumors. Six days later mice were euthanized and tumors were harvested. (A) Hoechst nuclear counterstained section shows Mo/Ma labeled with PKH26 in tumor. (B) Hematoxylin and eosin staining of serial sections shows irregular morphology demonstrating that the targeted area is a tumor. Scale bars = 100 μm. (C) Mo/Ma labeled with Hoechst before injection were injected into mice bearing Pan02 expressing firefly luciferase tumors. Five days later mice were euthanized and tumors were harvested. Sections were stained with rabbit α-firefly luciferase and DyLight® 650-goat α-rabbit (Abcam, Cambridge, MA) (sections were not counterstained with Hoechst). Immunohistochemistry verifies that the Mo/Ma infiltrate pancreatic tumors.
Notes: (A) Blue = Hoechst; red = PKH26 (Mo/Ma), (C) Blue = Hoechst (Mo/Ma); red = DyLight® 650 (Pan02 cells). Scale bar = 100 μm.
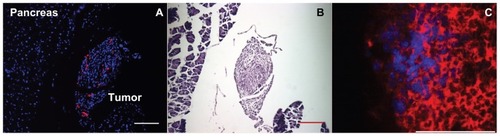
Figure 6 Heat generation by nanoparticle-loaded monocyte/macrophage-like cells.
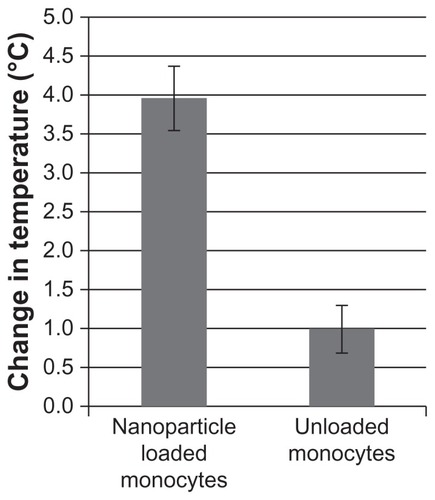
Figure 7 Duration to clinical symptoms (“survival”).
Notes: Mice were treated and monitored as described. Mice were euthanized when they displayed clinical signs of cancer and the day/time was recorded (n = 5 or 6 for each group). P < 0.005 for alternating magnetic field treatment versus all other groups.
Abbreviations: AMF, alternating magnetic field; Mo/Ma, monocyte/macrophage-like cells; NP, nanoparticle.
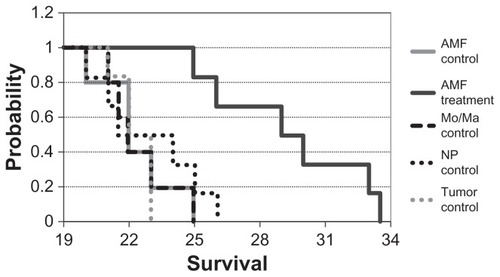
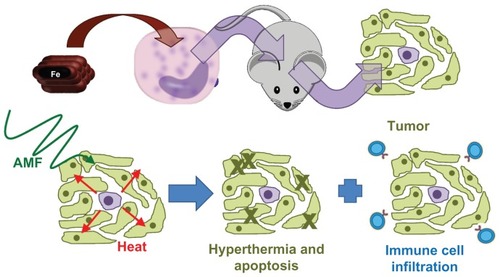
Figure 8 Model of the demonstrated system.
Notes: First, nanoparticles were loaded into monocyte/macrophage-like cells by inclusion in medium. The monocyte/macrophage-like cells were then injected intraperitoneally into mice bearing intraperitoneal Pan02 tumors and they specifically homed to the tumors. Three days after injecting the cells, the mice were exposed to an alternating magnetic field, which caused the nanoparticles to generate heat, leading to hyperthermia.
Abbreviations: AMF, alternating magnetic field; Fe, iron.