Figures & data
Figure 1 A schematic description of the experimental setup for the reflected light intensity measurements. Laser diode (650 nm) and an optical fiber (arrow) were used to irradiate the sample on a single point. The photodiode was in close contact with the sample surface. The micrometer plate moved in 20 incremental steps of 250 μm, enabling continuous measurements of the spatial reflectance from the sample, from 1 mm up to 6 mm from the laser diode position.
Abbreviations: EGFR, epidermal growth factor receptor; GNR, gold nanorod; PD, photodiode.
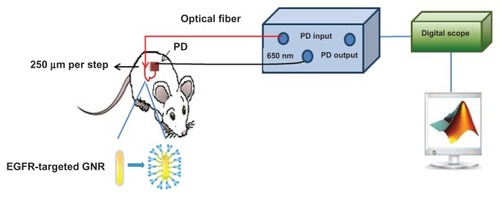
Figure 2 Ultra-violet visible absorption spectra (normalized) of bare GNRs (25 nm × 65 nm), PEG-coated and anti-EGFR-coated GNRs, and transmission electron microscopy image of the bare GNRs (inset).
Abbreviations: EGFR, epidermal growth factor receptor; GNRs, gold nanorod; PEG, polyethylene glycol.
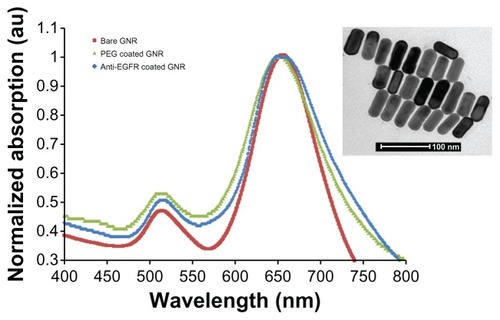
Table 1 Zeta potentials of bare, PEG-coated and anti-EGFR-coated GNRs
Figure 3 Diffusion reflection intensity (in semi-logarithmic scale) as a function of the distance between the detector and the light source, for different phantoms as follows: (A) homogeneous phantoms with the same reduced scattering property μs′ = 1.6 mm−1 but different absorption coefficients of 0.0064, 0.0126, 0.0180, 0.0227, and 0.0295 mm−1 (the solid, dashed, dotted, diamond marked, and triangle marked lines, respectively); and (B) a homogeneous phantom (the solid line) and phantoms with gold nanorod particles of different concentrations (the cross- and the circle-marked lines).
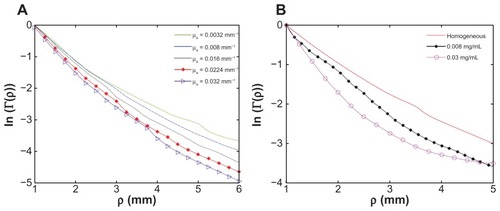
Figure 4 Comparison between the reflected light intensity slopes (absolute values) of the cancerous and normal tissues at several time points.
Notes: The results are the average of five to ten diffusion reflection measurements of different mice. The error bars represent error of the mean. The highest error bar is of the normal tissue immediately post injection, indicating different rates of the gold nanorod flow in the different mice’s blood.
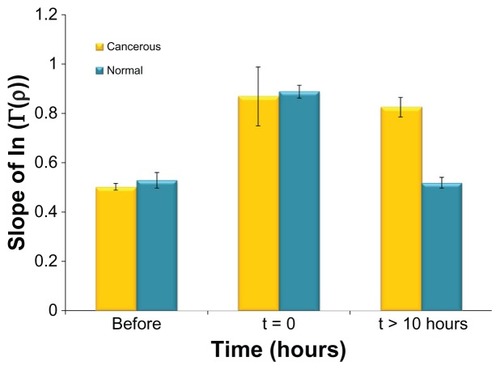
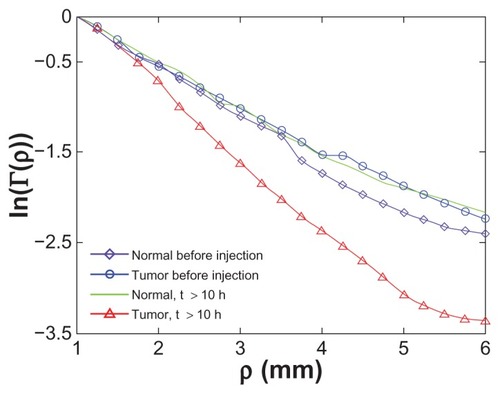
Figure 5 Diffusion reflection intensity (in semilogarithmic scale) as a function of the distance between the detector and the light source. The graph emphasizes the difference between the slopes before GNRs injection and >10 hours post-injection for the cancerous and normal tissues. While the absorption value and the reflectance slope of the normal tissue is the same before GNRs insertion and more than 10 hours post-injection, the tumor clearly presents a higher absorption value resulting in a sharper slope.
Abbreviation: GNRs, gold nanorods.