Figures & data
Figure 1 Experimental set-up for cell migration assay. Cell cultures were incubated with MNP-modified medium (A) and MNP-free medium (B).
Abbreviation: MNP, magnetic nanoparticle.
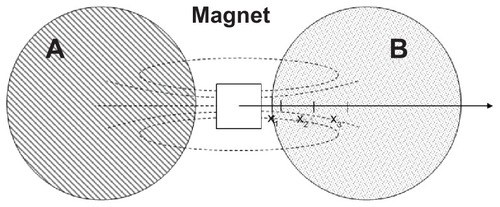
Figure 2 Cell cultures were incubated with MNP-modified medium (A) and MNP-free medium (B). (A) TEM image of naked Fe3O4 nanoparticles. Inset: histogram showing the particle size distribution. (B) TEM image of PLL-coated nanoparticles. Inset: high resolution magnification of a single PLL-coated Fe3O4 MNP.
Abbreviations: MNP, magnetic nanoparticle; PLL, poly-l-lysine; TEM, transmission electron microscopy.
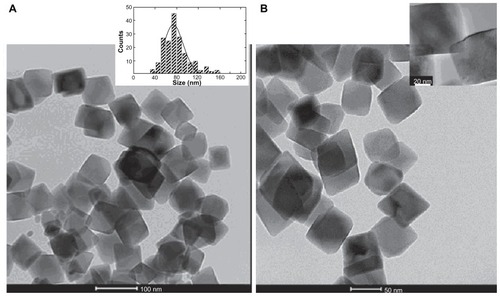
Figure 3 Zeta potential curves as a function of the pH for naked Fe3O4 nanoparticles (filled squares) and PLL-coated Fe3O4 nanoparticles (open circles).
Note: The lines are a guide for the eye.
Abbreviations: MNPs, magnetic nanoparticles; PLL, poly-l-lysine.
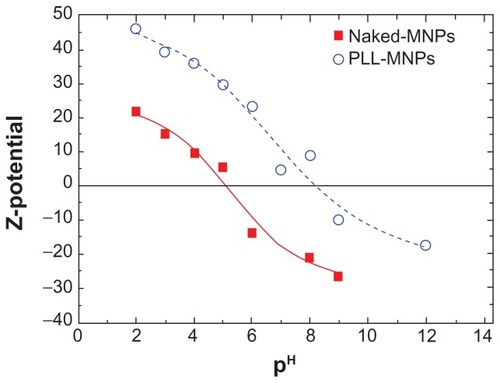
Figure 4 Magnetization data of PLL-coated Fe3O4 nanoparticles. (A) M(T) curves taken in zero-field and field-cooling modes using HFC = 7.97 kA/m. (B) M(H) magnetization curves at 10 K and 250 K.
Note: The inset shows a magnification of the low-field M(H) curves to better see the coercivity of the MNPs.
Abbreviations: MNPs, magnetic nanoparticles; PLL, poly-l-lysine.
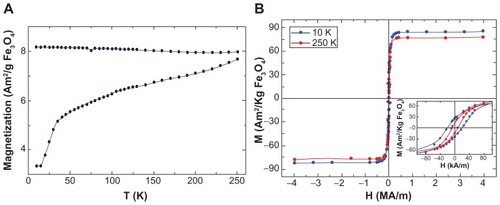
Table 1 Average diameter <d> of the magnetite core; saturation magnetization MS, and coercive field HC of the magnetic nanoparticles used in this work
Figure 5 Cell viability of SH-SY5Y cells from trypan blue staining, for increasing MNP concentration and incubation time using PLL-MNPs (A) and ARA-MNPs (B).
Abbreviations: ARA-MNPs, commercial fluidMAG-ARA magnetic nanoparticles; PLL-MNPs, poly-l-lysine-magnetic nanoparticles.
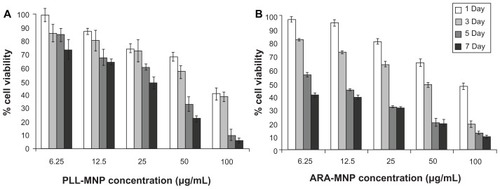
Figure 6 Primary Schwann cell cultures from the peripheral nervous system: (A) cell viability; (B) nuclear fast red and Prussian blue staining.
Notes: One-way ANOVA with Bonferroni post hoc test, *P < 0.001. Bar indicates 50 μm.
Abbreviation: PLL-MNPs, poly-l-lysine-magnetic nanoparticles.
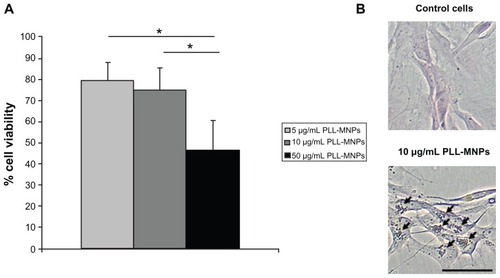
Figure 7 PLL-MNPs compared with ARA-MNP. Cell density (in arbitrary units) at different distances from the magnet for (A) SH-SY5Y cells and (B) primary cells. Control represents cells not treated with magnetic particles (n = 3). (C) Comparison of the magnetic force exerted by PLL-MNP and ARA-MNP as a function of the distance from the magnet.
Abbreviations: ARA-MNPs, commercial fluidMAG-ARA magnetic nanoparticles; PLL-MNPs, poly-l-lysine-magnetic nanoparticles.
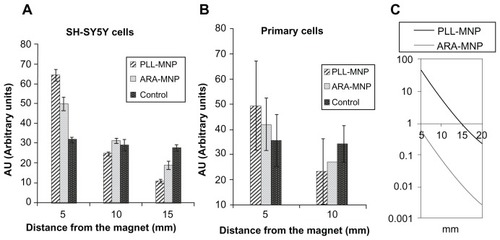
Table 2 Effect of the concentration of incubated PLL-MNPs on SH-SY5Y cell doubling time
Figure 8 Images showing ROS detection on SH-SY5Y cells treated for 24 hours with increasing concentration of PLL-MNP. (A and B) are the bright field and the fluorescent images, respectively, of the negative control; (C) is the fluorescent image of the positive control (cell treated with TBHP); (D–H) are fluorescent images of cells incubated with 1, 5, 10, 20, and 50 μg/mL of PLL-MNPs, respectively.
Abbreviations: PLL-MNP, poly-l-lysine-magnetic nanoparticle; TBHP, tert-butyl hydroperoxide.
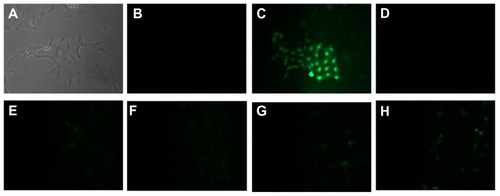
Figure 9 Internal iron content per cell at different times evaluated by Ferrazine method.
Abbreviation: PLL-MNP, poly-l-lysine-magnetic nanoparticle.
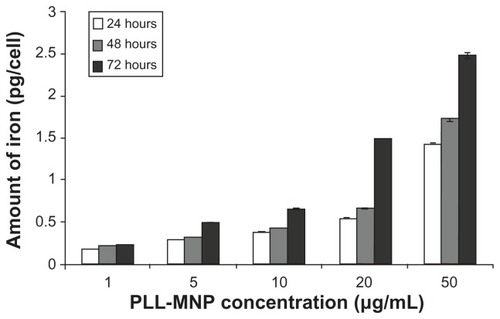
Figure 10 Scanning electron microscopy image of a single SH-SY5Y cell incubated for 24 hours with 10 μg/mL PLL-MNPs, showing the presence of MNP agglomerates (bright spots) on the cell membrane. Inset: Prussian blue staining on the same culture.
Abbreviations: MNP, magnetic nanoparticle; PLL-MNP, poly-l-lysine-magnetic nanoparticle.
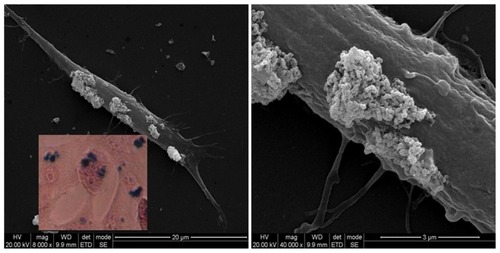
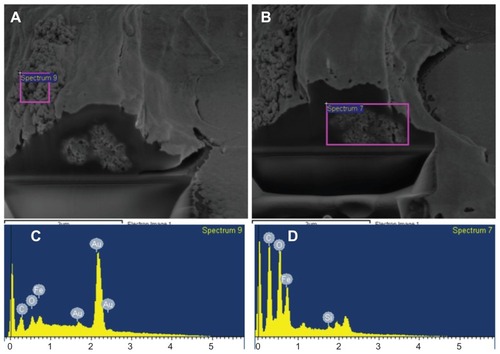
Figure 11 Cell viability dual-beam (FIB/SEM) images of SH-SY5Y cells incubated with 5 μg/mL PLL-MNPs for 24 hours. (C and D) are the EDX spectra from the corresponding areas of the (A and B) (pink squares), confirming the presence of MNPs in the cell membrane (A and C) and the intracellular space (B and D).
Abbreviations: FIB, focused ion beam; MNPs, magnetic nanoparticles; PLL-MNPs, poly-l-lysine-magnetic nanoparticles; SEM, scanning electron microscopy.