Figures & data
Figure 1 (A) Impedance measurement graph of cells grown on ECIS wells from 0 to 78 hrs. Inset shows the optical microscopic images of cells on circular detecting microelectrodes of ECIS wells, in which the images were taken (a) once after the cell addition, (b) after 10 hrs, and (c) after 15 hrs. (B) Impedance measurement of L929 cells with connexin hemichannel inhibitor (FFA).
Abbreviations: ECIS, electric cell-substrate impedance-sensing system; FFA, flufenamic acid.
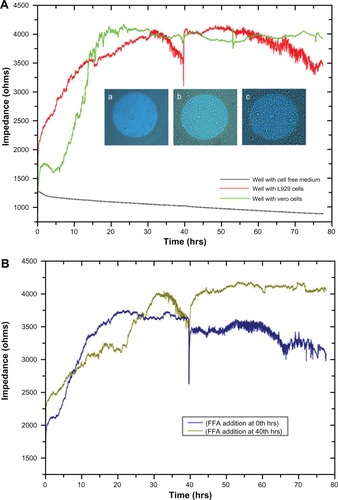
Figure 2 Inverse microscopic images of cells grown on Petri dishes taken at different time periods. A–I are images taken at 30, 30.5, 31, 55, 55.5, 56, 70, 70.5, and 71 hrs, respectively.
Notes: White arrows showing examples of lamellipodium extension and contraction, black arrows indicate retraction of lamellipodium to form approximately round shape, and block arrows show some examples of blebbing activity of L929 cells.
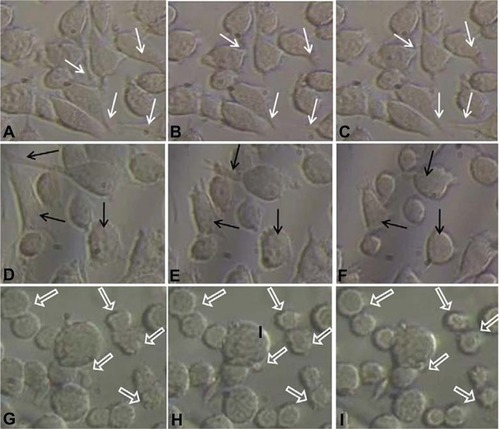
Figure 3 (A) Power spectrum analysis of L929 cellular oscillation compared to vero cells at different time periods from (a) 30 to 40 hrs and (b) 55 to 70 hrs. (B) Time-frequency plots for cellular oscillation. (a) L929 cells (b) vero cells.
Note: Black circles show oscillation frequencies.
Abbreviations: ATP, adenosine triphosphate; ECIS, electrical cell-substrate impedance-sensing system.
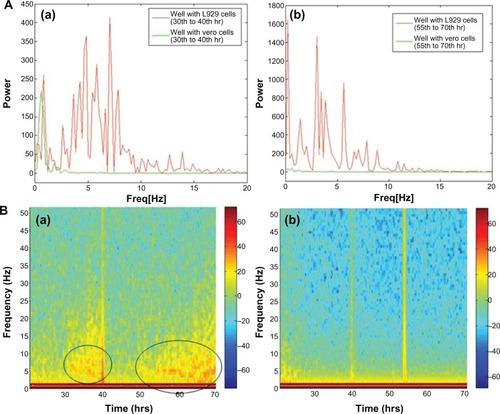
Figure 4 L929 cellular oscillatory mechanism and relationship with cellular blebbing motility.
Note: Small black arrows along the plasma membrane indicate cellular oscillatory movement and blue arrow indicates blebbing motility.
Abbreviations: ATP, adenosine triphosphate; ECIS, electric cell-substrate impedance-sensing system.
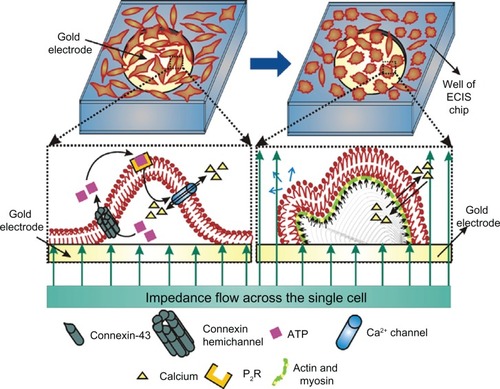
Figure 5 Fluorescent imaging of calcium flux from L929 cells without drug (FFA) and with drug at different time periods (0 hrs and 40 hrs).
Abbreviation: FFA, flufenamic acid.
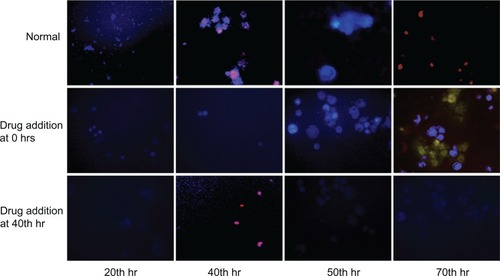
Figure 6 Quantitative analysis of ATP release from L929 cells without drug (FFA) and with drug at different time period (A) at 0 hrs (B) at 40 hrs.
Abbreviations: ATP, adenosine triphosphate; FFA, flufenamic acid.
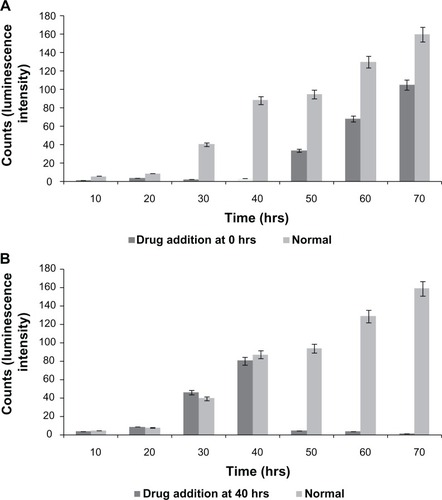
Figure S1 Photograph of eight-well one-electrode (8W1E) ECIS chip.
Note: Right image is the magnification of single well showing the circular detection electrode at the center and common counter electrode.
Abbreviation: ECIS, electric cell-substrate impedance-sensing system.
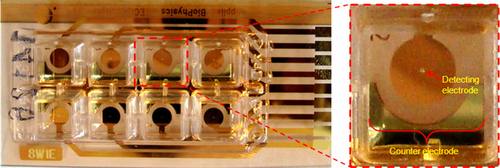
Figure S2 The whole experiment was repeated thrice and here are the results obtained for two experiments with L929, vero cell, and cell-free medium on a ECIS system.
Note: These results show the consistency of L929 cellular oscillation.
Abbreviation: ECIS, electric cell-substrate impedance-sensing system.
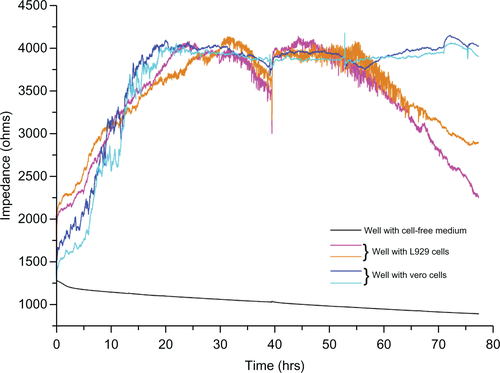
Figure S3 FFT analysis with log frequency of L929 cellular oscillation obtained from ECIS system between 30 to 40 hours.
Abbreviations: ECIS, electric cell-substrate impedance-sensing system; FFT, fast Fourier transform.
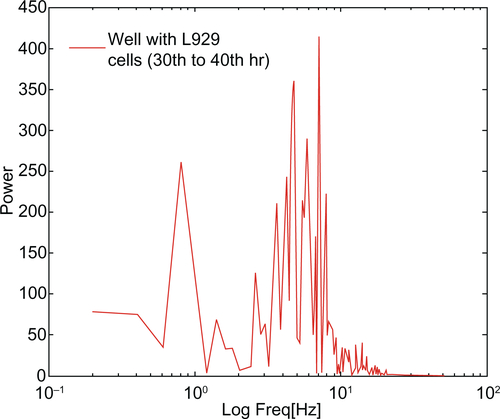
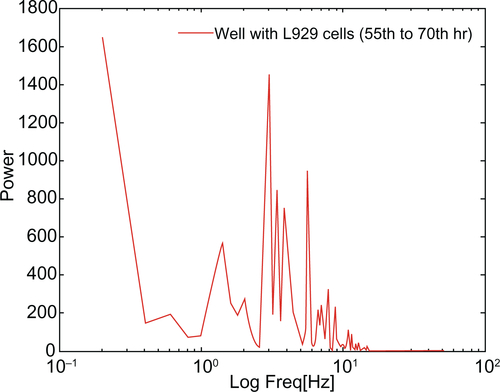
Figure S4 FFT analysis with log frequency of L929 cellular oscillation obtained from ECIS system between 55 to 70 hours.
Abbreviations: ECIS, electric cell-substrate impedance-sensing system; FFT, fast Fourier transform.