Figures & data
Figure 1 Heating curves from preliminary experiments: culture medium + gold nanorods + laser (black curve), culture medium + laser (gray curve).
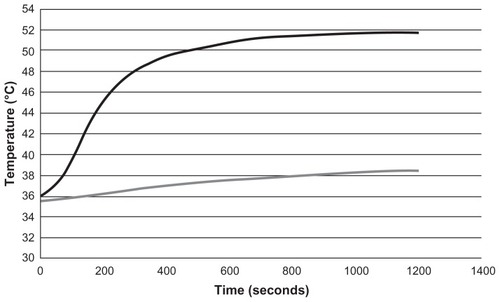
Figure 2 Viability of 1321N1 cells exposed to increasing concentrations of gold nanorods for 12 and 24 hours, as evaluated by MTT assay.
Notes: Each value represents the mean ± standard deviation of three independent experiments. Analysis of variance, post hoc Newman–Keuls test, and *P < 0.05 compared with untreated control cells.
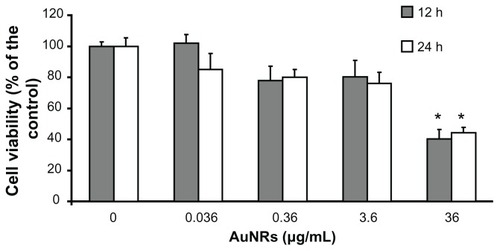
Figure 3 Localization of gold nanorods in 1321N1 cells by confocal laser scanning (A) and transmission electron (B and C) microscopy. (A) Cells were exposed to 36 μg/mL gold nanorods for 12 hours. After fixation, the cells were stained with phalloidin (red) and the nuclei were counterstained with ToPro-3 (blue). Gold nanorods were detected by reflectance (green). Images show that the gold nanorods (green) were effectively internalized into the cytosol of glioblastoma cells and were not excluded from the nuclei. The top and right margin plots in (A) clearly display gold nanorods in the cross-section of the cell (B and C). Transmission electron micrographs of gold nanorod-labeled 1321N1 cells.
Notes: Arrows point to gold nanorods located inside membrane-bound subcellular organelles. Scale bar in (A) 20 μm. Scale bars in (B) and (C) 100 nm.
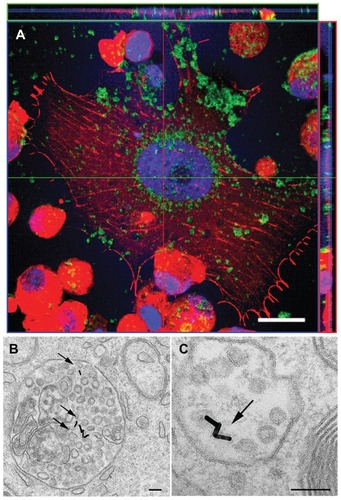
Figure 4 Cell viability after hyperthermia treatments. 1321N1 cells were stained with calcein and propidium iodide to visualize live (green) and dead (red) cells, respectively. (A and B) Control cells stained with calcein and propidium iodide, respectively. (C and D) 1321N1 cells irradiated with laser at 1.2 W for 20 minutes and subsequently stained with (C) calcein and (D) propidium iodide. (E and F) 1321N1 cells incubated with 36 μg/mL gold nanorods for 20 minutes and stained for (E) calcein and (F) propidium iodide. (G and H) 1321N1 cells incubated with 36 μg/mL gold nanorods and subjected to laser irradiation at 1.2 W for 20 minutes and then stained for calcein (G) and propidium iodide (H).
Notes: Inset in (H) shows an area of the same field at a higher magnification. Scale bar 50 μm.
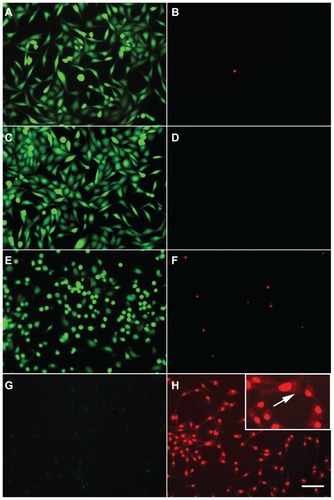
Figure 5 1321N1 cells stained to detect apoptosis using Hoechst (blue) and antiactivated caspase-3 antibody (red). (A) Control cells. (B) Cells irradiated with laser at 1.2 W for 20 minutes. (C) Cells incubated with 36 μg/mL gold nanorods for 20 minutes. (D) Cells irradiated with laser for 20 minutes in the presence of 36 μg/mL gold nanorods.
Notes: Only a few activated caspase-3-positive cells were detected when incubated with gold nanorods, indicated by arrows in (C). Positive cells were present in a very low number compared with the apoptotic cells obtained when cells were treated with staurosporine, in which a high number of caspase-3-positive cells were observed, shown in the inset in (C). No chromatin condensation visualized by Hoechst or activated caspase-3-positive cells were seen in the other conditions tested (A, B, and D).
Note: Scale bar, 50 μm.
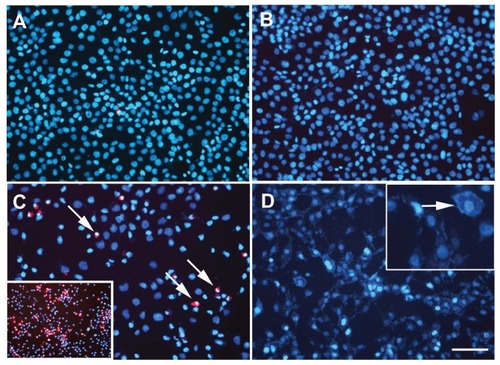
Figure 6 Photothermal treatment of 1321N1 cells by near infrared irradiation at 1.2 W for 20 minutes. Flow cytometry analysis of 1321N1 cell death by labeling with propidium iodide after hyperthermia treatment. The cells were stained with propidium iodide and then fixed and analyzed on a flow cytometer. The graph shows the percentages of dead cells (IP+-cells) over total cells, calculated for each condition. Control: 1321N1 basal cell death rate. AuNRs: 1321N1 cells incubated with 36 μg/mL gold nanorods for 20 minutes. Laser: 1321N1 cells subjected to laser irradiation at 1.2 W for 20 minutes. Laser + AuNRs: 1321N1 cells subjected to laser irradiation at 1.2 W for 20 minutes in the presence of 36 μg/mL gold nanorods.
Notes: Values are the means ± standard error of the mean of three independent experiments performed in triplicate. *P < 0.005 versus control cells, analysis of variance, post hoc Tukey’s test.
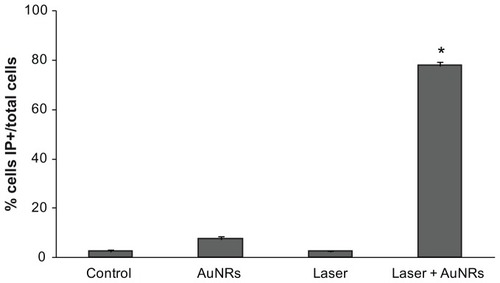
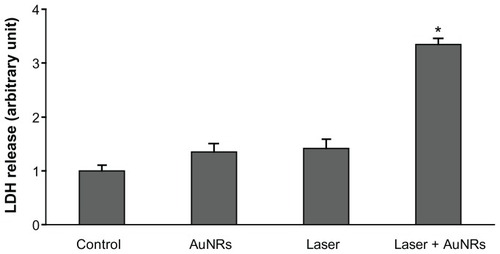
Figure 7 Lactate dehydrogenase released into the culture medium in response to different treatments. Control: A relative value of 1 was assigned to the lactate dehydrogenase released into the culture medium by 1321N1 cells in basal conditions. AuNRs: 1321N1 cells incubated with 36 μg/mL gold nanorods for 20 minutes. Laser: 1321N1 cells irradiated with 1.2 W laser for 20 minutes. Laser + AuNRs: 1321N1 cells irradiated with laser at 1.2 W for 20 minutes in the presence of 36 μg/mL gold nanorods.
Notes: Values are the mean ± standard error of the mean of three independent experiments performed in triplicate. *P < 0.005 versus control cells, analysis of variance, post hoc Tukey’s test.