Figures & data
Figure 1 Experimental time line for BTB disruption. EB was injected intravenously several minutes before sonication. Pulsed HIFU was applied 15 seconds after UCA administration in the right hemispheres. Rats were perfused 30 minutes after sonication to allow EB quantification.
Abbreviations: EB, Evans blue; HIFU, high-intensity focused ultrasound; UCA, ultrasound contrast agent.
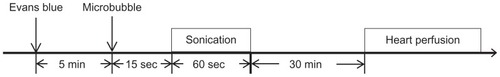
Table 1 MRI parameters used in this study
Figure 2 Mean body weight in grams of glioma-bearing rats during tumor progression.
Notes: *P < 0.05; **P < 0.01.
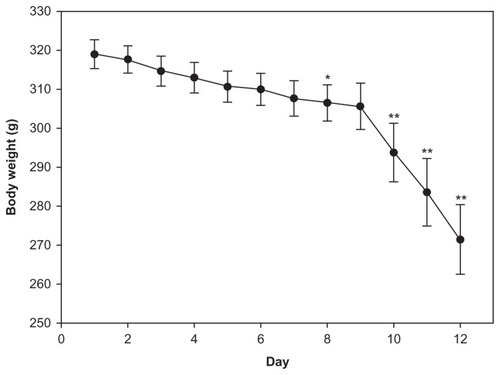
Figure 3 Mean tumor weight (A) (0.009 ± 0.003, 0.012 ± 0.003, 0.034 ± 0.007 g) and tumor volume (B) (0.02 ± 0.01, 0.06 ± 0.01, 0.17 ± 0.02 cm3) in glioma-bearing rats on days 6, 8, and 12 after tumor implantation.
Notes: *P < 0.05; **P < 0.01.
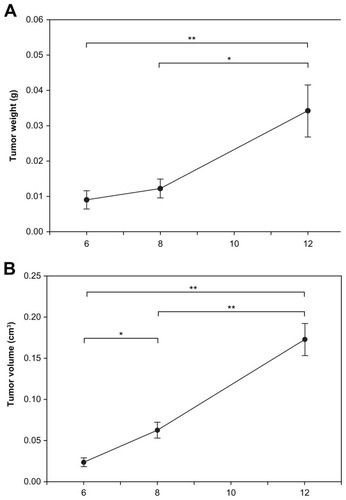
Table 2 Tumor:ipsilateral normal brain ratios
Figure 4 Distribution of BBB disruption for brain tumors as evaluated by extravasation of EB into the brain. Right brain: tumor with pulsed HIFU exposure. Left brain: control tumor without pulsed HIFU exposure. The tumor area and sonication path are consistent with the MR images in .
Abbreviations: BBB, blood–brain barrier; EB, Evans blue; HIFU, high-intensity focused ultrasound; MR, magnetic resonance.

Figure 5 Concentration of EB in the tumor and neighboring normal brain regions with and without sonication. The EB extravasation in the brain tumor with sonication was significantly higher than in brain tumor without sonication. Compared with normal tissues neighboring the control tumors, there was a significant difference for the control tumors and for the neighboring normal tissues of sonicated tumors on all days and on days 6 and 8, respectively.
Notes: *P < 0.05; **P < 0.01; ***P < 0.001.
Abbreviation: EB, Evans blue.
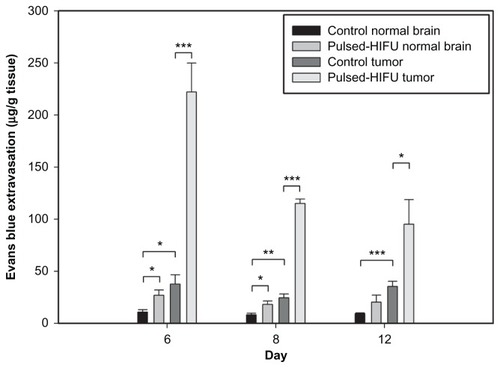
Figure 6 The ratio of EB concentration between sonicated tumor and control tumor (A) and the derived tumor:ipsilateral brain ratios after sonication and without sonication (B) during tumor progression.
Abbreviation: EB, Evans blue.
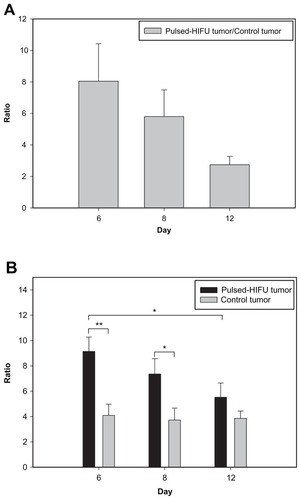
Figure 7 Images of the tumors with and without pulsed HIFU exposure by (A) T1-weighted MR images, (B) hematoxylin-eosin-stained sections, and (C) TUNEL staining on days 6, 8, and 12 after implantation. The tumor progression and sonication pathway can be monitored in the MR images. H&E and TUNEL stained sections were observed for histology and apoptotic evaluation.
Abbreviations: H&E, hematoxylin-eosin; HIFU, high-intensity focused ultrasound; MR, magnetic resonance; TUNEL, terminal deoxynucleotidyl transferase dUTP nick end labeling.
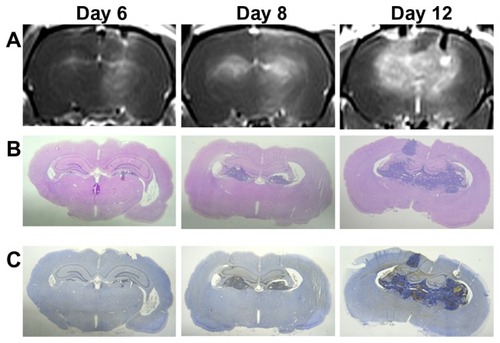
Figure 8 In vivo magnetic resonance images of rats bearing F98 gliomas in the (A) coronal view and (B) axial view. The spatial distribution of brain tumor BBB disruption with and without sonication in the right and left hemispheres, respectively, is shown. The rat brains were analyzed 30 minutes following gadolinium administration. Regions of contrast enhancement >4, >8, >12, and >16 standard deviations above the average MRI signal intensity of the normal brain tissue are shown in green, yellow, blue, and red respectively.
Abbreviations: BBB, blood–brain barrier; MRI, magnetic resonance imaging.
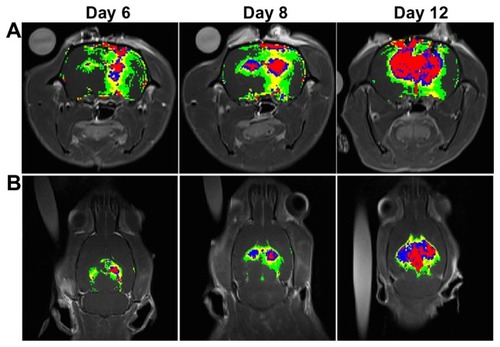
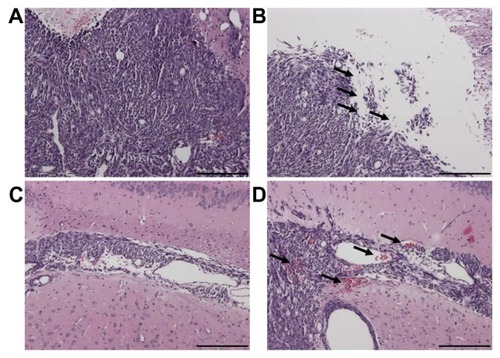
Figure 9 The structure of the contralateral brain tumor without sonication (A and C) and of the brain tumor tissue with sonication (B and D) by H&E staining (original magnification × 100 from ; scale bar = 200 μm). Local displacement and increased extravasation of red blood cells were indicated by arrows in the sonicated tumor tissues in and around the focal region.
Abbreviation: H&E, hematoxylin-eosin.