Figures & data
Figure 1 Stability of emulsions made from oil (soybean oil plus curcumin)/water/surfactants (lecithin plus Tween 80), stored at 25°C. Microemulsions shown as open circles were found to be stable; (×): microemulsions were unstable.
Note: Tween 80:lecithin ratios were varied from 1:1 to 24:1, with no significant change in microemulsion stability with the same total surfactant.
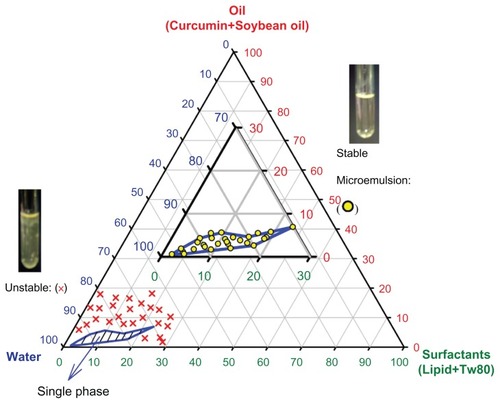
Figure 2 (A) The stability of curcumin microemulsions (ME) stored at 5°C, assessed by measurements of mean particle size (top curve, left axis) and zeta potential (lower curve, right axis.) The size is very stable. The zeta potential shows only a slight decrease in magnitude over 968 days. (B) The stability of ME when stored in albumin solutions, as assayed by droplet size.
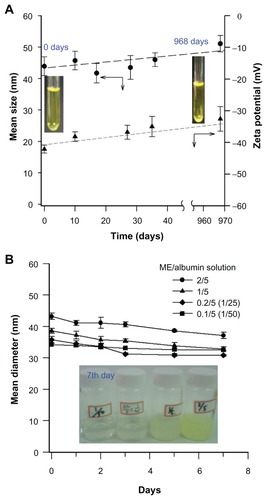
Figure 3 (A) Mean sizes (black circles) and polydispersity (green squares); (B) curcumin concentrations (black triangles) and zeta potentials (blue diamonds) of curcumin microemulsions after brief insonation.
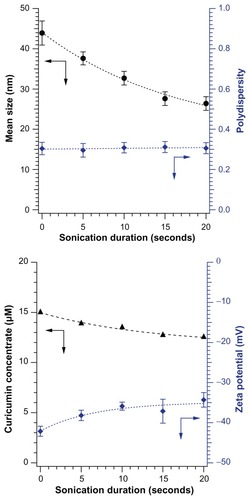
Figure 4 The MTT viability test results on (A) oral squamous cell carcinoma-4 and (B) oral squamous cell carcinoma-25 cells after different insonation duration, in buffer alone (without addition of curcumin microemulsion), 20% (circle), 30% (upper triangle), 40% (lower triangle), and 60% (diamond) of full sound power. (C) The sudden decrease in viability after 20 seconds of insonation at 20% power may be caused by a temperature increase; the temperature increases nearly 6°C in this time.
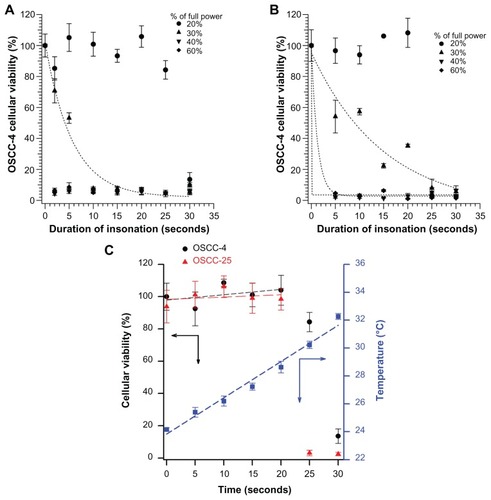
Figure 5 (A) Size distributions (from cumulant analysis of light scattering data) of microemulsion droplets, applying ultrasound from 0 seconds to 20 seconds, (B) the field emission scanning electron microscopy (insert) and transmission electron microscopy of curcumin micoremulsion without ultrasound, (C) after 10 seconds of ultrasound, the released material (essentially soybean oil) floats to the surface and is picked up on a grid and imaged by field emission scanning electron microscopy.
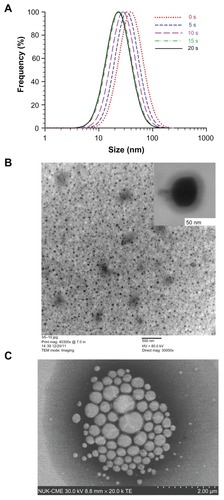
Figure 6 Viability (via MTT test) of cells after treatment with different concentrations of curcumin-containing microemulsions. Cells in 96-well plates were treated with different dilutions (in phosphate buffered saline) of a 15 μM curcumin microemulsion, then exposed or not to ultrasound (US) at 20% power level for 20 seconds: (A) oral squamous cell carcinoma (OSCC)-4 and (B) OSCC-25 cell lines.
Note: The OSCC-25 cell line had a decrease of about a factor of six in the LD50 for the microemulsion.
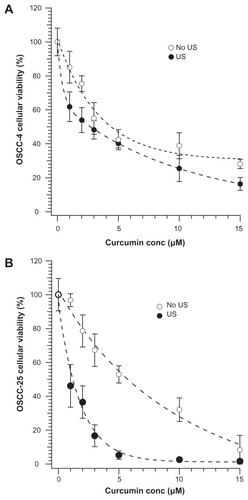
Figure 7 Optical microscope images of oral squamous cell carcinoma-25 cell lines stained by trypan blue; (A–D) show the microscopic images of cells with curcumin concentrations at 0 μM, 5 μM, 10 μM, and 150 μM without sonication, and (E and H) show the microscopic images of cells with curcumin concentrations at 0 μM, 5 μM, 10 μM, and 15 μM after sonication treatment.
Note: Those images show the synergy of microemulsion treatment with ultrasound in producing cytotoxicity.
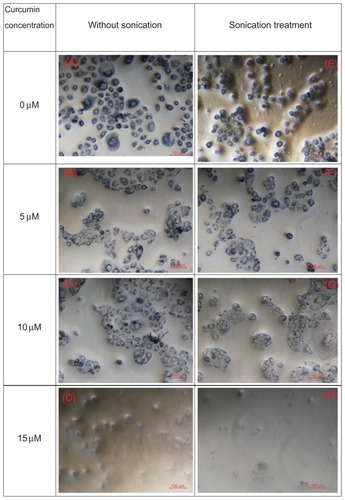
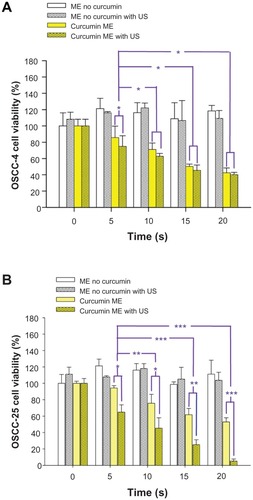
Figure 8 The cellular viability (via MTT test) when (A) oral squamous cell carcinoma (OSCC)-4 and (B) OSCC-25 cell lines were treated with curcumin-free microemulsions (ME) without ultrasound (US) (control), curcumin-free ME and US, curcumin-containing ME (5 μM curcumin) without US, and curcumin-containing ME with insonation.
Notes: Comparing curcumin-free and curcumin-containing groups at the same US condition, the curcumin-containing ME at OSCC-4 and OSCC-25 cell lines were significantly different (*P < 0.05, **P < 0.006, P < 0.002) when analyzed by Student’s t-test.