Figures & data
Figure 1 Structure of QDs and M-POSS.
Notes: (A) MSA-QDs; (B) POSS-QDs; (C) M-POSS. MSA-QDs have ample surface COOH groups to allow solubility and stability. POSS-QDs have both hydrophobic and hydrophilic surface groups, giving them amphiphilic properties. Structure of M-POSS (C) shows a caged structure with predominant Si-O-Si and surface Si-C bonds. R groups promote solubility in organic solvents and thiol (-SH) group binds to QD core metal surface.
Abbreviations: QD, quantum dots; M-POSS, mercaptopropylisobutyl-polyhedral oligomeric silsesquioxane; MSA-QDs, mercaptosuccinic acid quantum dots; POSS-QDs, polyhedral oligomeric silsesquioxane quantum dots.
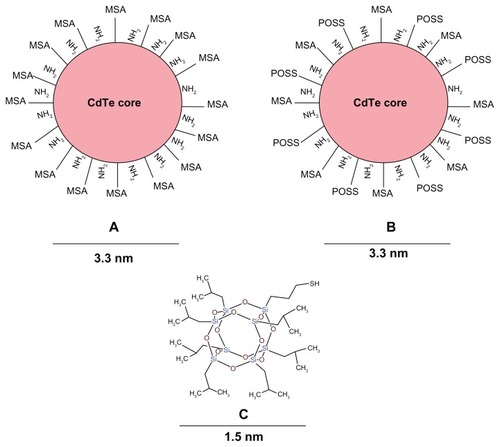
Figure 2 Transmission electron microscopy.
Notes: (A) POSS-QDs; (B) MSA-QDs. The core sizes of CdTe in (A) and (B) are 3.3 nm. Both QDs (A and B) were well dispersed, although some darker areas in A may reflect free POSS. Scale bars represent 20 nm. Magnification × 300,000.
Abbreviations: POSS-QDs, polyhedral oligomeric silsesquioxane quantum dots; MSA-QDs, mercaptosuccinic acid quantum dots; QDs, quantum dots; POSS, polyhedral oligomeric silsesquioxane.
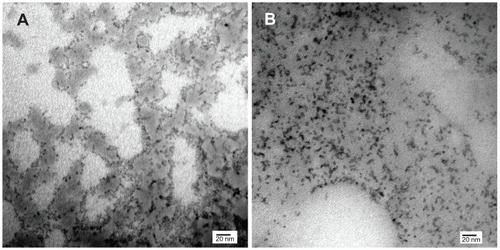
Figure 3 Fluorescence emission spectra of POSS and MSA-QDs.
Notes: POSS-QDs emit at 630 nm and MSA-QDs at 635 nm. There is no significant difference in the peak emission wavelength of both QDs, although POSS-QDs have a slightly broader FWHM compared to MSA-QDs.
Abbreviations: POSS, polyhedral oligomeric silsesquioxane; MSA-QDs, mercaptosuccinic acid quantum dots; POSS-QDs, polyhedral oligomeric silsesquioxane quantum dots; QDs, quantum dots.
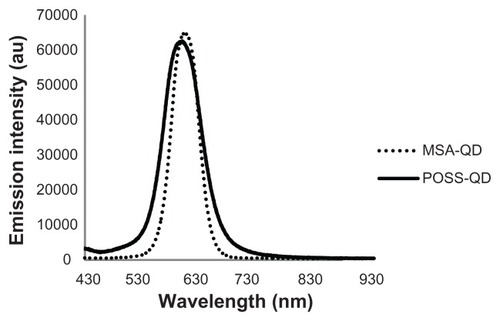
Figure 4 FTIR spectra of dry MSA powder, MSA-QDs, POSS-QDs and M-POSS.
Notes: (A) POSS and MSA-QDs show common peaks at 1402 cm−1 and 1565 cm−1 from strong symmetric and asymmetric vibrations of the amino acid cysteine. However, POSS-QDs show a new peak at 1043 cm−1 that corresponds to stretching vibrations from Si-O-Si bonds in POSS; (B) M-POSS demonstrates a prominent peak at 1087 cm−1 from Si-O-Si bonds that shifts to a 1043 cm−1 on the POSS-QDs indicating that POSS has bonded to the QD surface.
Abbreviations: FTIR, Fourier transform infrared spectroscopy; MSA, mercaptosuccinic acid; MSA-QDs, mercaptosuccinic acid quantum dots; POSS-QDs, polyhedral oligomeric silsesquioxane quantum dots; M-POSS, Mercaptopropylisobutyl-polyhedral oligomeric silsesquioxane; POSS, polyhedral oligomeric silsesquioxane; QDs, quantum dots.
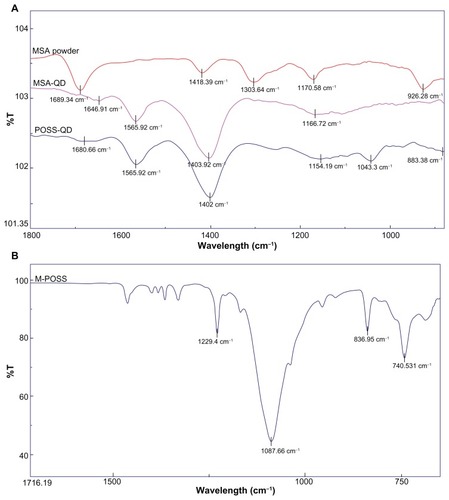
Figure 5 Photostabilty of POSS and MSA-QDs.
Notes: On exposure to UV illumination for 2 hours, POSS-QDs undergo photo-oxidation at a much slower rate showing significantly enhanced photostability compared to MSA-QDs. P value < 0.05.
Abbreviations: POSS, polyhedral oligomeric silsesquioxane; MSA-QDs, mercaptosuccinic acid quantum dots; POSS-QDs, polyhedral oligomeric silsesquioxane quantum dots.
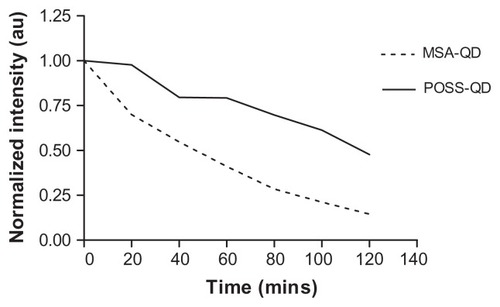
Figure 6 In vitro toxicity of ionized Cd+2 and Te−2 to Hep G2 cells.
Notes: Both metals have profound toxicities, with cadmium being toxic at all concentrations at 1 and 24 hours compared with tellurium, which is toxic at all concentrations except 1.25 μg/mL at 1 hour. **P < 0.01.
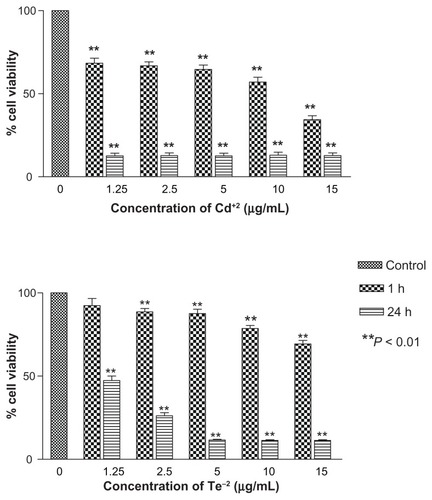
Figure 7 In vitro toxicity of POSS and MSA-QDs to Hep G2 cells.
Notes: Different concentrations of QDs were compared to the control group. Both POSS and MSA-QDs are biocompatible at 2.5 μg/mL at 1 and 24 hours. POSS-QDs show lower cell viability at 5 μg/mL at 24 hours compared to MSA-QDs, although there is no significant difference in cell viability between the 2 QDs at higher concentrations of 10 and 15 μg/mL. *P < 0.05; **P < 0.01.
Abbreviations: POSS, polyhedral oligomeric silsesquioxane; MSA-QDs, mercaptosuccinic acid quantum dots; QDs, quantum dots; POSS-QDs, polyhedral oligomeric silsesquioxane quantum dots.
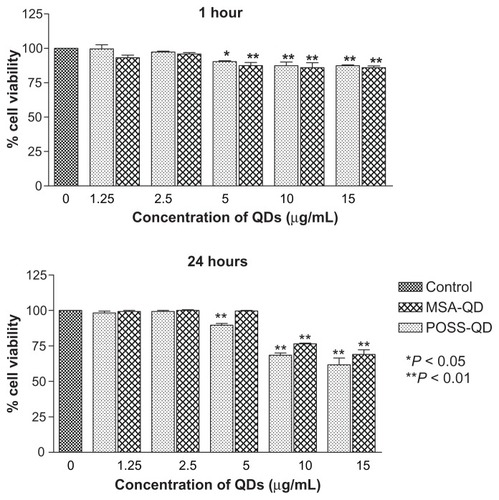
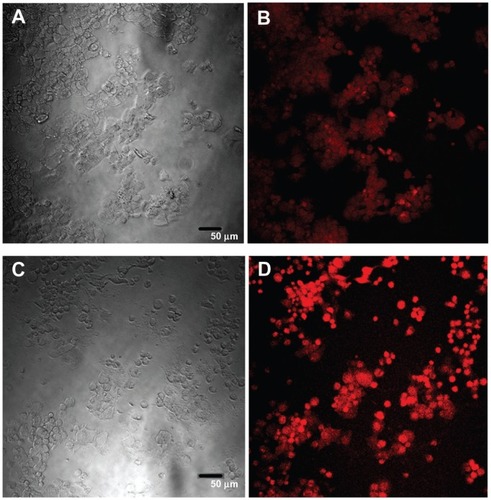
Figure 8 Confocal images of HepG2 cells incubated with QDs for 1 hour. (A) Differential interference contrast (DIC) image of cells incubated with MSA-QDs; (B) Fluorescent image of A; (C) DIC image of cells incubated with POSS-QDs; (D) Fluorescence image of C; POSS-QDs (D) appear more brightly fluorescent than MSA-QDs (B) at 1 hour.
Notes: The images are pseudo-colored. The scale bar is set to 50 μm.
Abbreviations: QD, quantum dots; MSA-QDs, mercaptosuccinic acid quantum dots; POSS-QDs, polyhedral oligomeric silsesquioxane quantum dots.
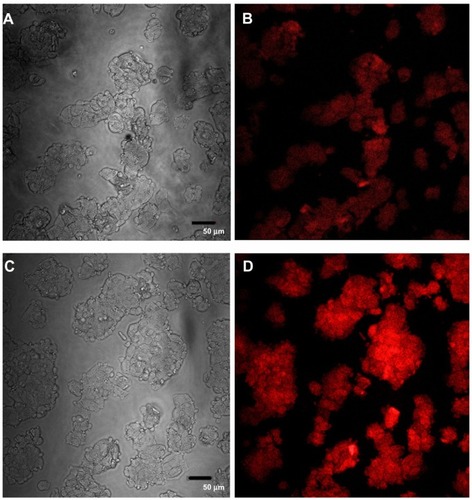
Figure 9 Confocal images of HepG2 cells incubated with QDs for 24 hours.
Notes: (A) differential interference contrast (DIC) Image of cells exposed to MSA-QDs; (B) Fluorescent image of A; (C) DIC image of cells exposed to POSS-QDs (D) Fluorescence image of C. Both POSS and MSA-QDs maintain high cellular numbers and intracellular fluorescence indicating uptake of QDs. POSS-QDs (D) appear brighter than MSA-QDs (C).
Abbreviations: QD, quantum dots; MSA-QDs, mercaptosuccinic acid quantum dots; POSS-QDs, polyhedral oligomeric silsesquioxane quantum dots; POSS, polyhedral oligomeric silsesquioxane.