Figures & data
Figure 1 Characterization of nanoparticles.
Notes: (A) Particle size and (B) zeta potential of LPHNs-cRGD. (C) Fluorescent image of DiI-labeled LPHNs-cRGD. (D) and (E) TEM image of LPHNs- cRGD, White arrow: lipid layer and polymer core of nanoparticles, respectively. (F) Protection assay of LPHNs-cRGD from DNaseI. Lane 1, DNA maker; Lane 2, untreated pCas9/MGMT; Lane 3, naked pCas9/MGMT after incubation with DNase I for 3min; Lanes 4–8 correspond to the extracted pCas9/MGMT from LPHNs-cRGD after incubation with DNase I for 3 min, 15 min, 30 min, 1 h and 2 h, respectively.
Abbreviations: LPHNs, lipid–polymer hybrid nanoparticles; cRGD, cyclic arginine-glycine-aspartic acid; DiI, 1.1’-dioctadecyl-3,3,3’,3’-tetramethylindocarbocyanine perchlorate; TEM, transmission electron microscopy; pCas9/MGMT, Cas9/MGMT plasmid; DNase I, Deoxyribonuclease I.
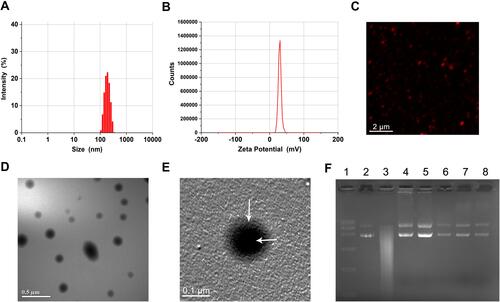
Figure 2 Targeting ability, biosafety, and transfection efficiency of LPHNs-cRGD in vitro.
Notes: (A) The LSCM images of T98G cells with different treatments (Control, DiI-labeled LPHNs, DiI-labeled LPHNs-cRGD). The scale bar is 20 μm. (B) Cell viability at various concentrations of LPHNs and LPHNs-cRGD in T98G cells after 48 h (n=3). (C) and (D) FCM and statistical analysis of EGFP-positive T98G cells after transfected with different pCas9/MGMT formulations for 48 h. (E) Microscopy images of EGFP expression in T98G cells after transfected with different pCas9/MGMT formulations for 48h. The scale bar is 50 μm.
Abbreviations: LPHNs, lipid–polymer hybrid nanoparticles; cRGD, cyclic arginine-glycine-aspartic acid; LSCM, laser scanning confocal microscopy; DiI, 1,1’-dioctadecyl-3,3,3’,3’-tetramethylindocarbocyanine perchlorate; FCM, flow cytometry; EGFP, enhanced green fluorescent protein; pCas9/MGMT, Cas9/MGMT plasmid.
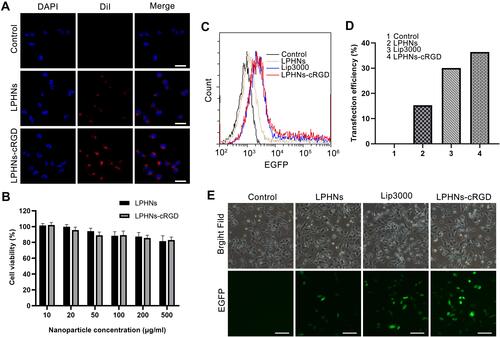
Figure 3 Chemosensitivity testing induced by LPHNspCas9/MGMT-cRGD.
Notes: (A) Western blotting for analyzing the MGMT expression in T98G cells after different treatments. (B) Cell viability of T98G cells after different treatments including control, LPHNspCas9/MGMT-cRGD, TMZ, LPHNspCas9/MGMT + TMZ and LPHNspCas9/MGMT-cRGD + TMZ (n=4). (C) FCM analysis of apoptosis after different treatments.
Abbreviations: LPHNs, lipid–polymer hybrid nanoparticles; pCas9/MGMT, Cas9/MGMT plasmid; cRGD, cyclic arginine-glycine-aspartic acid; MGMT, O6-methylguanine-DNA methyltransferase; TMZ, temozolomide; FCM, flow cytometry.
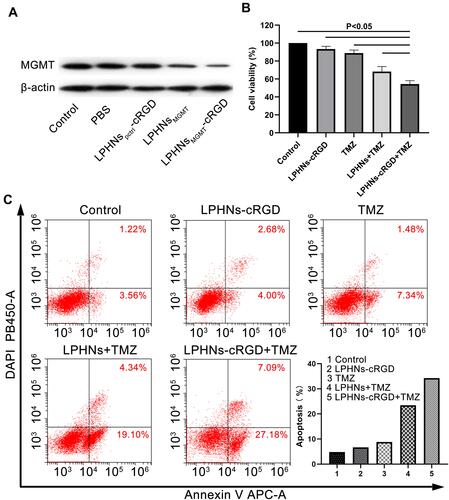
Figure 4 BBB-opening experiment in vivo.
Notes:(A) Bright-field microscopy image of MBs, The scale bar is 10 μm. (B) Fluorescence image of MBs-LPHNs-cRGD complexes. LPHNs-cRGD was stained by DiO (green, left), MBs were stained by DiI (red, middle), the green dots around the red bubble indicated that LPHNs-cRGD and MBs were bound together (merged, right). The scale bar is 1 μm. (C) Particle size and (D) zeta potential of MBs-LPHNs-cRGD complexes. (E) Digital photography of EB leakage (top two rows) and H&E staining of corresponding black rectangle region (bottom two rows) for BBB – opening induced by FUS-assisted MBs-LPHNs-cRGD. White arrow: erythrocyte extravasation. The FUS radiation time and amounts of MBs-LPHNs-cRGD were 3 min and 2 x 10⁶ (line 1); 3 min and 4 x 10⁶ (line 2); 5 min and 4 x1 06 (line 3) and 3 min and 8 x1 06 (line 4), respectively. The scale bar is 2 mm for digital photography and 50 μm for H&E staining, respectively.
Abbreviations: MBs, microbubbles; LPHNs, lipid–polymer hybrid nanoparticles; cRGD, cyclic arginine-glycine-aspartic acid; DiO, 3.3’-dioctadecyloxacarbocyanine perchlorate; DiI, 1,1’-dioctadecyl-3,3,3’,3’- tetramethylindocarbocyanine perchlorate; EB, Evan blue; BBB, blood brain barrier; FUS, focused ultrasound; H&E, hematoxylin-eosin.
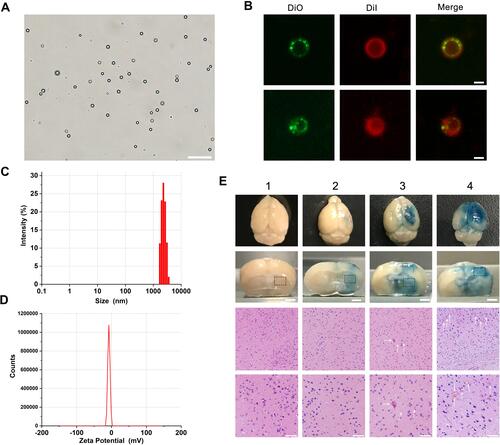
Figure 5 Targeting ability and distribution of MBs-LPHNs-cRGD under FUS irradiation in vivo.
Notes: (A) MRI images of orthotopic tumor 7 days (left) and 14 days (right) after implantation of T98G cells; (B) in vivo fluorescence images of the distribution of DiR-labeled LPHNs or LPHNs-cRGD in T98G tumor-bearing mice at 2 h and 24 h after different treatments; (C) ex vivo fluorescence images of major organs and brain of mice after 24 h of treatments. (D) Corresponding quantitative analysis of fluorescence intensity in major organs (n=3).
Abbreviations: MBs, microbubbles; LPHNs, lipid–polymer hybrid nanoparticles; cRGD, cyclic arginine-glycine-aspartic acid; MRI, magnetic resonance imaging; DiR, 1,1’-dioctadecyl-3,3,3’,3’- tetramethylindotricarbocyanine iodide.
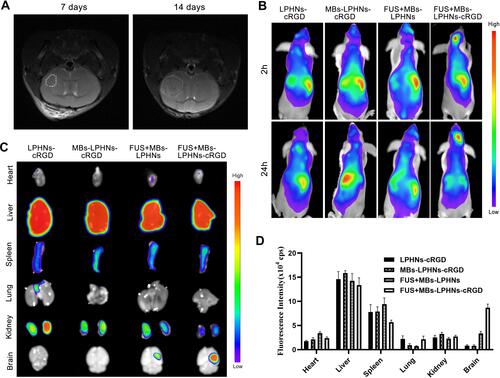
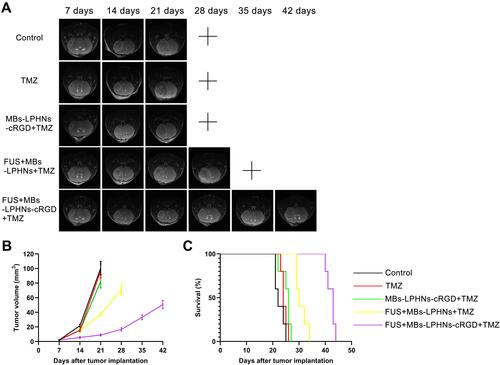
Figure 6 Evaluation of antitumor efficacy in vivo.
Notes: (A) MRI images of tumors monitored every 7 days of different treatments. “+” indicates that the mice were sacrificed due to severe neurological symptoms. (B) Tumor volume based on MRI images (n=3, P < 0.05). (C) Kaplan-Meier survival curve of tumor-bearing mice with different treatments (n=5).
Abbreviation: MRI, magnetic resonance imaging.