Figures & data
Figure 1 Experiments of preparation, characterization, and stability of SNX10-shRNA plasmids nanoparticles. (A) Schematic illustration of SRP-NPs. (B) After 48 h of transfection, the expression of SNX10 in RAW264.7 and HTC-116 cells was determined by qRT-PCR. Determination of (C) particle size, (D) PDI values, (E) ζ-potential, (F) entrapment efficiency, (G) drug loading of SRP-NPs at different weight ratios. (H) SEM photo of SRP-NPs at the weight ratio of 1 showed that the nanoparticles are spherical and uniform particle size of about 275 nm, consistent with the measured data by particle size analyzer. Bars=1000 nm. (I) The turbidity of the nanoparticles was measured by the turbid metric method to investigate the stability under different pH storage conditions. *P < 0.05, **P < 0.01, ***P < 0.001 vs control group, ns- not significant.
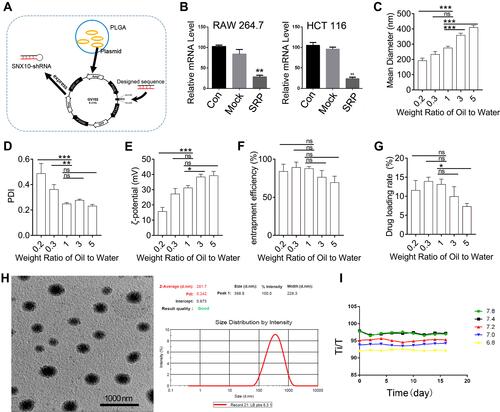
Figure 2 Interference efficiency of SRP-NPs in vivo and in vitro. (A) Experiments were performed on human HCT-116 cells and murine RAW264.7 cells, respectively. Con means the control group (1 mg/mL MP-NPs), L means the low dose group (0.2 mg/mL SRP-NPs) and H means the high dose group (1 mg/mL SRP-NPs). The level of SNX10 mRNA was detected by qRT-PCR after 48 h of treatment. (B) HCT116 cells were incubated with PBS, naked SRP (containing an equivalent amount of SRP-NPs in the high dose group), and SRP-NPs for 1, 8 h, and then cellular uptake of TOTO-3-labeled nanoparticles was determined by a confocal microscope. (C) After 3 days of oral administration, the expression of SNX10 of colon mucosa was determined by qRT-PCR. Con (control groups, 3 mg/20 g, MP-NPs); L (low dose group, 0.2 mg/20 g, SRP-NPs); H (high dose group,3 mg/20g, SRP-NPs). *P < 0.05, **P < 0.01, ***P < 0.001 vs the control group or L group. (D) Mice (n=16) were randomly divided into two groups. The control group received 3 mg/20 g of MP-NPs, and the drug group received 3 mg/20 g of SRP-NPs. After 3 days of oral administration, the expression of SNX10 of several organs was determined by qRT-PCR. Ri/R: Value of SNX10 mRNA relative to the control group.**P < 0.01 vs control group.
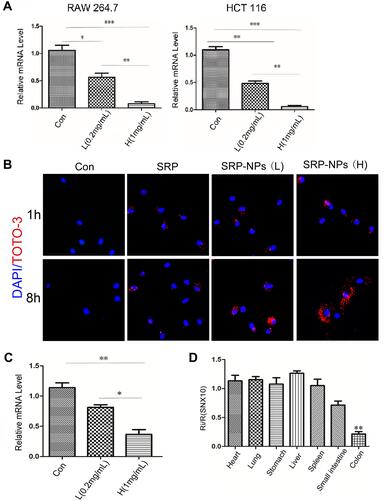
Figure 3 The effects of SRP-NPs on an acute mouse model of IBD. (A) 40 mice were randomly divided into five groups with eight mice in each group: Normal, DSS, DSS + Mock (3 mg/20 g MP-NPs), DSS + L (1 mg/20 g SRP-NPs), and DSS + H group (3 mg/20 g SRP-NPs). After 3 days of continuous administration as described above, 2.5% DSS was administered. Weight loss was measured daily and expressed as the average percentage of initial body weight ± SEM. (B) The length of colons from mice was measured on day 7 after euthanasia. (C) Representative histological images of mice on the 7th day were compared. (D) Colon mucosa damage index (CMDI) scoring was assessed in a blinded fashion. (E) The mRNA expression of colon mucosa SNX10 was measured by qRT-PCR. *P<0.05, **P < 0.01, ***P < 0.001 vs DSS+Mock group; #P < 0.05, ##P < 0.01vs Normal group; n = 8 in each group.
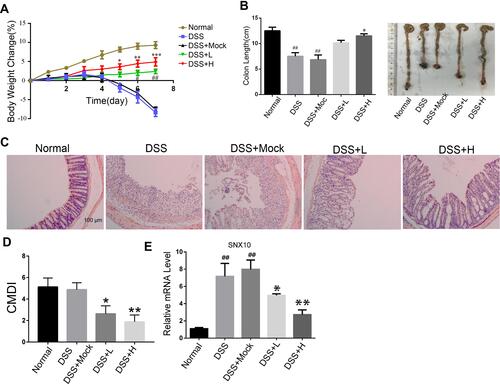
Figure 4 Levels of inflammatory cytokines in acute IBD models. (A) The mRNA expression of IL-1β, TNF-α, and IL-23 of colon mucosa were measured by qRT-PCR. (B) The concentration of IL-1β, TNF-α, and IL-23in the serum of mice were measured by ELISA.*P<0.05, **P < 0.01vs DSS+Mock group; #P < 0.05, ##P < 0.01vs Normal group; n = 8 in each group.
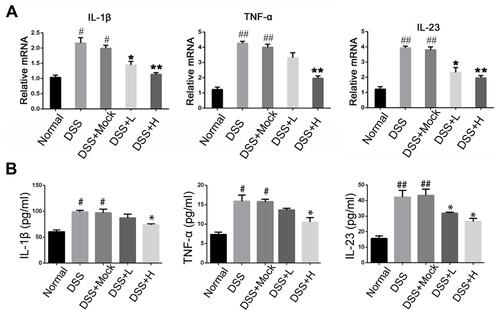
Figure 5 The effects of SRP-NPs on a chronic mouse model of IBD. (A) 40 IL10−/-mice were randomly divided into five groups with eight mice in each group: KO, Mod, Mod + Mock (3 mg/20 g MP-NPs), Mod + L (1 mg/20 g SRP-NPs), and Mod + H group (3 mg/20 g SRP-NPs).After 3 days of continuous drug administration as described above, piroxicam (200 ppm) was added to the diet for 4 days. Weight loss was measured for 60 days and expressed as the average percentage of initial body weight ± SEM. (B) The length of colons from mice was measured at day 60 after euthanasia. (C) Representative histological images of mice on the 60th day were compared. (D) Colon mucosa damage index scoring (CMDI) was assessed in a blinded fashion. (E) The mRNA expression of SNX10 of colon mucosa was measured by qRT-PCR. *P<0.05, **P < 0.01, ***P < 0.001 vs Mod+Mock group; ##P < 0.01, ###P < 0.001 vs KO group; n = 8 in each group.
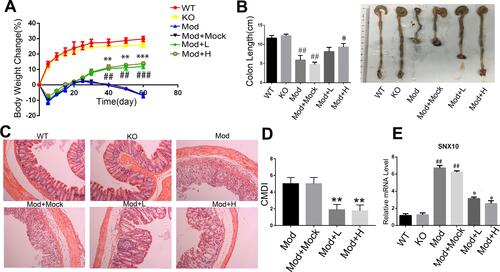
Figure 6 Levels of inflammatory cytokines in chronic IBD models. (A) The mRNA expression of IL-1β, TNF-α, and IL-23 of colon mucosa were measured by qRT-PCR. (B) The concentration of IL-1β, TNF-α, and IL-23 in the serum of mice were measured by ELISA. *P<0.05, **P < 0.01, vs DSS+Mock group; #P < 0.05, ##P < 0.01vs Normal group; n = 8 in each group.
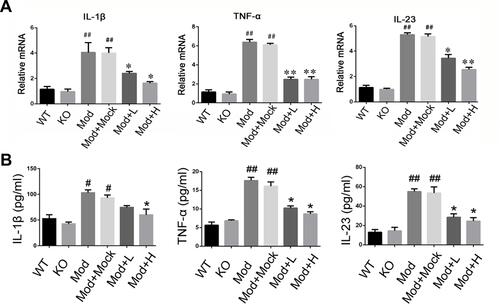
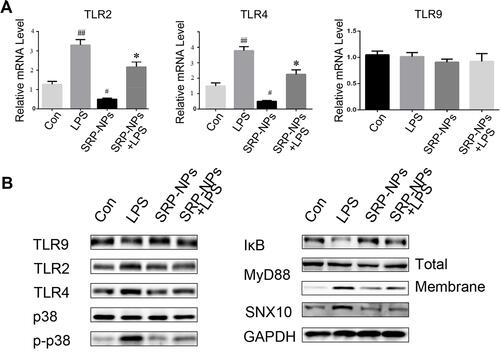
Figure 7 SRP-NPs down-regulate the TLR signaling pathway. (A) HCT116 cells were treated with LPS at 1 ug/mL for 0.5 h and SRP at 500 μg/mL. After 6 hours, the mRNA expression of TLR2, TLR4, and TLR9 of cells was measured by qRT-PCR. #P<0.05, ##P<0.01 vs control group; *P<0.05 vs LPS. (B) The above-treated cells were treated in radio-immunoprecipitation assay buffer (RIPA), and total or membrane proteins were extracted for Western blot analysis.