Figures & data
Figure 1 (A) Schemes for two size-dependent nanoimmunoresponses induced by smaller thiol-organosilica particles and larger thiol-organosilica particles, and two possible routes, enterohepatic route and mucosal route, of two size-dependent IgA secretions. (B) Electron micrograph of different sizes of fluorescent thiolorganosilica particles.
Note: Scale bar = 1 μm.
Abbreviations: FAE, follicle associated epithelium; IgA, immunoglobulin A; paracellular-E pathway, paracellular pathway between enterocytes; Rh, rhodamine B; SED, subepithelial dome; transcellular-E pathway, transcellular pathway through enterocytes; transcellular-M pathway, transcellular pathway through M cell.
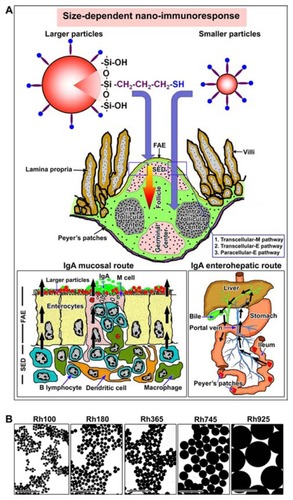
Table 1 Average sizes with standard deviations and coefficient variants of fluorescent thiol-organosilica particles containing Rh
Figure 2 Fluorescent microscope images showing the FAE of PPs that had been stained with lectin UEA I (a marker for alpha-L-fucose residue on M cells) after 4 hours of oral administration of different sizes of fluorescent thiol-organosilica particles. (A) Control, M cells were scattered in the FAE, and alpha-L-fucose residue was expressed on the surface and upper cytoplasm of M cells. PP after administration of (B) Rh100 particles, (C) Rh180 particles, (D) Rh365 particles, (E) Rh745 particles, and (F) Rh925 particles. The expression of alpha-L-fucose residue on the surface and cytoplasm of M cells increased more in animals that had been administered Rh745 or Rh925 than in animals that had been administered the smaller particles Rh100, Rh180, or Rh365 or the control.
Note: Scale bar = 50 μm.
Abbreviations: FAE, follicle-associated epithelium; PPs, Peyer’s patches; Rh, rhodamine B; SED, subepithelial dome; UEA I, Ulex europaeus agglutinin I.
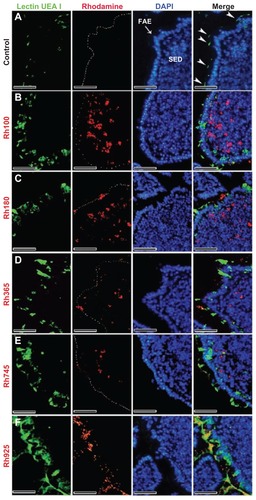
Figure 3 Fluorescent microscope images showing the SED of PPs stained with CD11b (Mac 1α chain) antibody (CD11b) (a marker for macrophages) after 4 hours of oral administration of different sizes of fluorescent thiol-organosilica particles. (A) Control, macrophages scattered in the SEDs of PPs. PPs after administration of (B) Rh100 particles, (C) Rh180 particles, and (D) Rh365 particles; there was co-localization of particles and Cd11b+ macrophages, and the number of CD11b+ macrophages increased compared with the control. PPs after administration of (E) Rh745 particles and (F) Rh925 particles; the number of CD11b+ macrophages were similar to that of the control. CD11b+ macrophages aggregated under the FAE of PPs after administration of all particle sizes.
Note: Scale bar = 50 μm.
Abbreviations: FAE, follicle associated epithelium; PPs, Peyer’s patches; Rh, rhodamine B; SED, subepithelial dome.
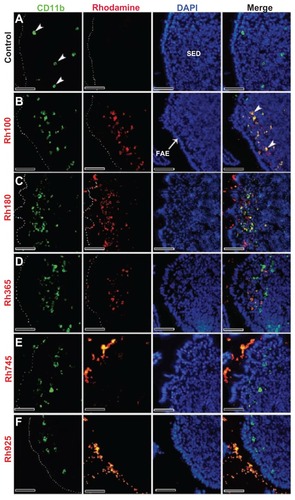
Figure 4 Fluorescent microscope images showing the SED of PPs stained with 33D1 antibody (a marker for DCs) after 4 hours of oral administration of differently sized fluorescent thiol-organosilica particles. (A) Control, 33D1+ DCs scattered in the SED of the PPs. PPs after administration of (B) Rh100 particles, (C) Rh180 particles, and (D) Rh365 particles; there was no co-localization of particles and 33D1+ DCs. The number of 33D1+ DCs was similar to the control. PPs after administration of (E) Rh745 particles and (F) Rh925 particles; the number of 33D1+ DCs increased when compared with the control. 33D1+ DCs aggregated under the FAE of the PPs after administration of all particle sizes.
Note: Scale bar = 50 μm.
Abbreviations: DCs, dendritic cells; FAE, follicle associated epithelium; PPs, Peyer’s patches; Rh, rhodamine B, SED, subepithelial dome.
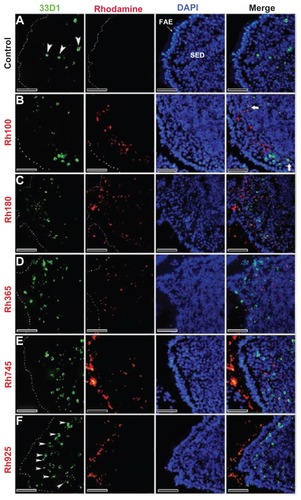
Figure 5 Fluorescent microscope images showing PPs at high magnifications after 4 hours of oral administration of Rh100 fluorescently labeled thiol-organosilica particles. (A) CD11b+ macrophages containing particles scattered in the SED of the PPs and aggregated under the FAE of the PPs; large numbers of particles co-localized with CD11b+ macrophages. (B) 33D1+ DCs scattered in the SED of the PPs; there was little co-localization of the particles with 33D1+ DCs.
Note: Scale bar = 25 μm.
Abbreviations: DCs, dendritic cells; FAE, follicle associated epithelium; PPs, Peyer’s patches; Rh, rhodamine B; SED, subepithelial dome.
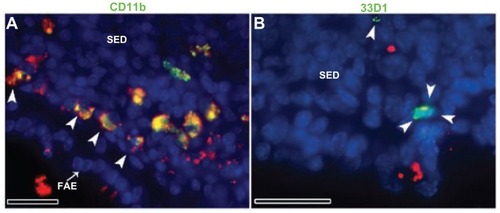
Figure 6 Fluorescent microscope images showing the SED of PPs stained with IgA antibody after 4 hours of oral administration of different sizes of fluorescently labeled thiolorganosilica particles. (A) Control, IgA+ cells scattered in the SED of the PPs. PPs after administration of (B) Rh100 particles, (C) Rh180 particles, and (D) Rh365 particles; there was no co-localization of the particles and IgA+ cells. The number of IgA+ cells in animals treated with the smaller particles (Rh100, Rh180, and Rh365) increased compared with the control. PPs after administration of (E) Rh745 particles and (F) Rh925 particles; the number of IgA+ cells were similar to that of the control, but IgA expression on the surface of M cells increased when compared with the smaller-sized particles or the control (white quadrates and enlarged parts of merged (E) and (F)).
Notes: Scale bar = (A–F), 50 μm; enlarged sections of merged (E) and (F), 10 μm.
Abbreviations: DCs, dendritic cells; FAE, follicle associated epithelium; IgA, immunoglobulin A; PPs, Peyer’s patches; Rh, rhodamine B; SED, subepithelial dome.
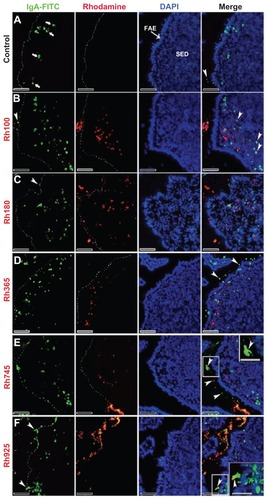
Figure 7 Fluorescent microscope images showing intestinal lumen (Lu) stained with IgA antibody after 4 hours of oral administration of fluorescently labeled Rh100 or Rh925 thiol-organosilica particles. (A) Control, IgA+ cells (bold arrows) in the villi (V) lamina propria; and (B) Rh100 particles inside the intestinal lumen; no IgA expression inside the lumen was observed, similar to the control. (C) The Rh925 particles inside the intestinal lumen; IgA proteins that were secreted into the lumen and the leukocyte (arrow heads) number increased when compared with that of Rh100-administered animals.
Note: Scale bar = 50 μm.
Abbreviations: IgA, immunoglobulin A; Lu, lumen; Rh, rhodamine B; V, villi.
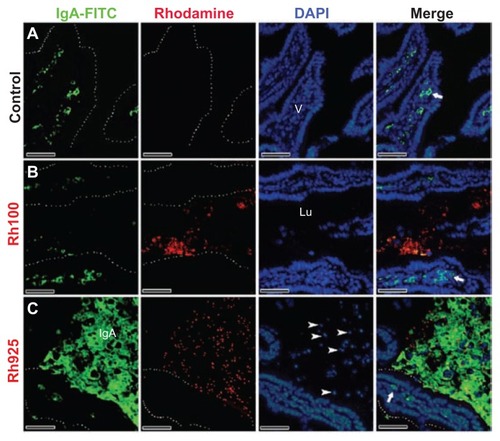
Figure 8 Quantitative analysis of the nanoimmunoresponse of immune cells from PPs 4 hours after oral administration of different-sized, fluorescently labeled, thiolorganosilica particles. Immune cells of PPs were counted in 0.154 ± 0.004 mm2 sections of the SEDs of PPs. The uptake of smaller particles (Rh100) increased the number of CD11b+ macrophages and IgA+ cells two- and fourfold, respectively, when compared with larger particles (Rh925) or five- and sevenfold, respectively, when compared with the control. In contrast, mechanical adhesion of larger particles increased the number of 33D1+ DCs twofold when compared with smaller particles or the control.
Note: Bars represented means ± standard deviations (n = 20).
Abbreviations: DCs, dendritic cells; IgA, immunoglobulin A; PPs, Peyer’s patches; Rh, rhodamine B; SED, subepithelial dome.
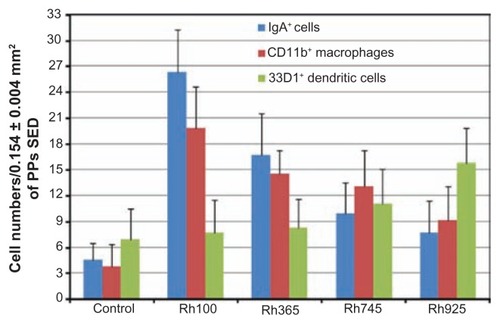
Figure 9 Western blotting analysis of IgA induction after 4 hours of oral administration of Rh100 or Rh925 particles. Western blotting analysis of IgA induction in (A) the bile (5 μg/each lane), (B) the intestinal secretions (10 μg/each lane), and (C) in PP homogenates (15 μg/each lane). Smaller thiol-organosilica particles (Rh100) induced IgA in both PP homogenates and bile secretions when compared with larger particles (Rh925); however, the opposite was true for intestinal secretions.
Abbreviations: IgA, immunoglobulin A; PPs, Peyer’s patches; Rh, rhodamine B.
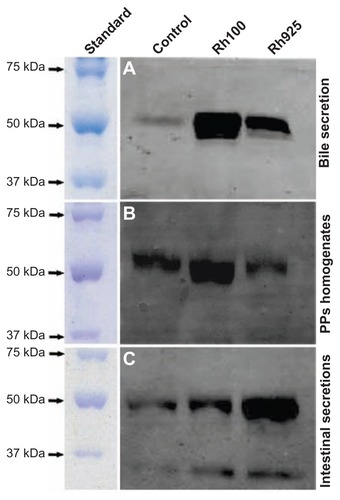
Figure 10 Densitometric analysis of IgA induction in the bile, intestinal secretions and PP homogenates after 4 hours of oral administration of Rh100 or Rh925 particles.
Note: Bars represent means ± standard deviations (n = 4).
Abbreviations: IgA, immunoglobulin A; PPs, Peyer’s patches; Rh, rhodamine B.
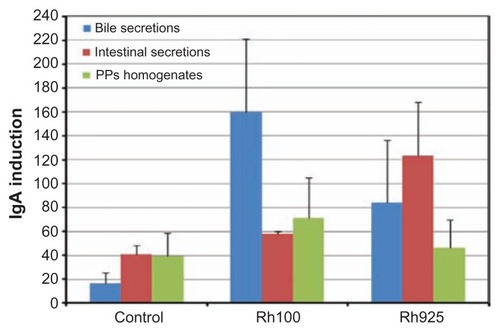
Table 2 A summary of the size-dependent co-localization of thiol-organosilica particles and the immune cells from PPs.
Figure S1. Electron photomicrographs showing the colocalization of Rh130 thiol-organosilica particles and PP SED cells.
Note: Scale bar = (A) 2 μm; (B) 1 μm; (C) 200 nm.
Abbreviations: PPs, Peyer’s patches; Rh, rhodamine B; SED, subepithelial dome.
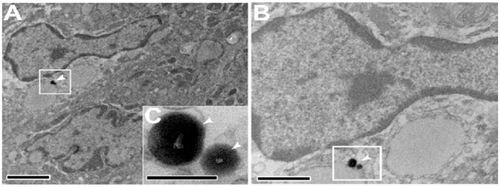
Figure S2. Electron photomicrographs showing, (A–E) The colocalization of Rh130 particles with PP SED cells. (G and H) The diffusion of Rh130 thiol-organosilica particles between the PP SED cells.
Note: Scale bar = (A), (D), (G), 2 μm; (B), 1 μm; (E), (H), 500 nm; (C), (F), (I) 200 nm.
Abbreviations: PPs, Peyer’s patches; Rh, rhodamine B; SED, subepithelial dome.
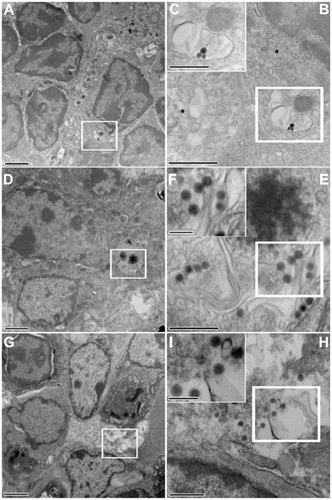
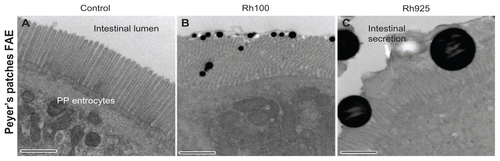
Figure S3. Electron photomicrographs showing the PP FAE enterocytes and the mechanical adhesion of thiol-organosilica particles. (A) The control of PP FAE, (B) mechanical adhesion of Rh100 on PP FAE, (C) mechanical adhesion of Rh925 on PP FAE.
Note: Scale bar = (A); (B); and (C), 700 nm.
Abbreviations: FAE, follicle associated epithelium; PPs, Peyer’s patches; Rh, rhodamine B.