Figures & data
Table 1 Effect of Different Tween® 80 Concentrations on Particle Size, Polydispersity Index and Zeta Potential of Blank NLC (Mean ±SD, n=3)
Figure 1 Transmission electron microscopy images of nanoparticles loaded with ciprofloxacin (CLP-NLC) at 8000 and 150,000× magnification power.
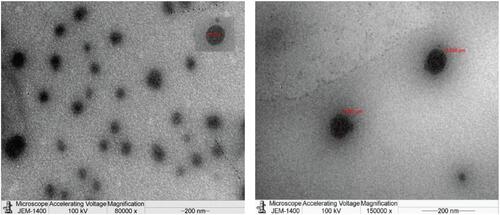
Figure 2 In vitro release of free ciprofloxacin and nanostructured lipid carriers loaded with ciprofloxacin (CIP-NLC) in phosphate buffer saline (PBS) PH 7.4 at 37°C.
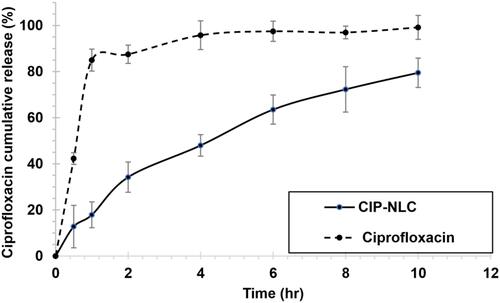
Table 2 Release Kinetic Data of the Investigated Nanoparticles Loaded with Ciprofloxacin (CIP-NLC)
Figure 3 Zone of inhibition of ciprofloxacin on different microbial strains. +ve: control (5 µg of CIP), -ve: blank or non-loaded NLCs. (A) Ciprofloxacin loaded nanostructured lipid carrier (CIP-NLC), (B) spray dried CIP-NLC with different chitosan: lipid ratios (C1: NCMP1, C2: NCMP2, C3 NCMP3).
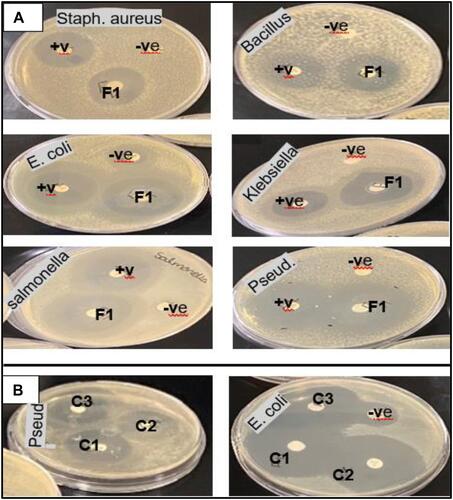
Table 3 The % Yield, Drug Content, Fine Particle Dose (FPD), Percentage Fine Particle Fraction (FPF), and Mass Median Aerodynamic Diameter (MMAD) of NCMPs (Mean ± S.D., n=3)
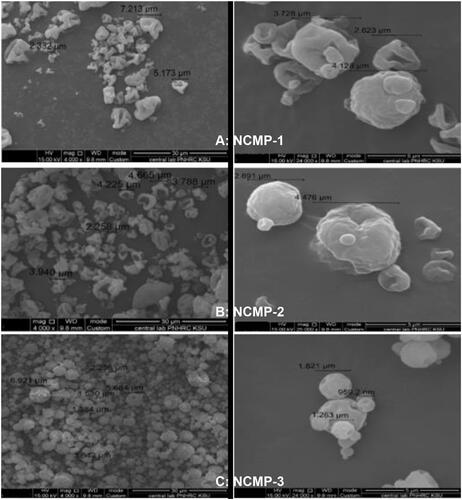
Figure 4 SEM photographs of liposomes spray dried in the presence of different ratios of chitosan (w/w). (A) NCMP1 at lipid:CH ratio of 1:0.5, (B) NCMP2 at lipid:CH ratio 1:1, (C) NCMP3 at lipid:CH ratio of 1:1.5. Pictures were taken at 4000× and 25,000× magnifications.