Figures & data
Table 1 Surface roughness of unmodified and nanotubular titanium (20 V voltage) surfaces
Figure 1 Scanning electron microscope images of (A) 20 V voltage nanotubular anodized titanium under low magnification and high magnification, and nanotubular anodized titanium cross-sections; (B) 25 V voltage nanotubular anodized titanium under low magnification and high magnification, and nanotubular anodized titanium cross-sections; and (C) unmodified titanium.
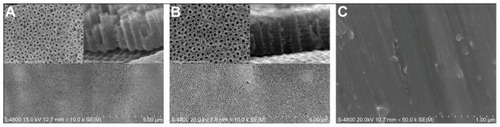
Figure 2 Atomic force microscope images of (A) nanotubular anodized titanium (20 V voltage) and (B) unmodified titanium.
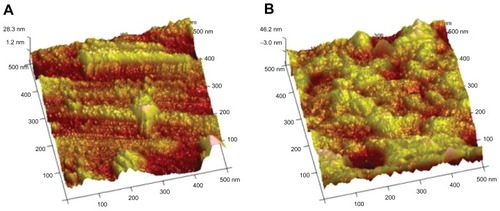
Table 2 Contact angle (in degrees) and surface energy components of unmodified and nanotubular titanium (20 V voltage) surfaces (in mJ/m2)
Figure 3 (A) Loading efficiency of CNN2 (connective tissue growth factor) in nanotubes; fraction of total CNN2 released from 100 nm diameter nanotubes filled with (B) 25 ng and (C) 50 ng of CNN2; (D) fraction of total CNN2 released from 120 nm diameter nanotubes filled with 50 ng of CNN2.
Notes: The marked time point on each graph indicates when maximum protein has been released, after which the amount of additional drug eluted was negligible. Concentrations at these time points are significantly different from those at time points before (P < 0.05), but were not significantly different from the time points after; n = 3.
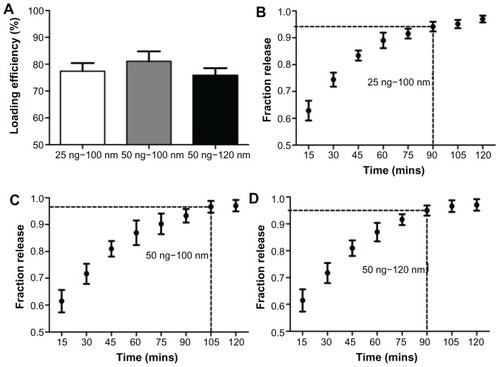
Figure 4 Cell viability on CCN2 (connective tissue growth factor)-loaded nanotubular titanium, nanotubular titanium, and unmodified titanium surfaces.
Notes: n = 6; *P < 0.05 compared to nanotubular titanium; **P < 0.05 compared to unmodified titanium.
Abbreviations: CNN2, connective tissue growth factor; Ti, titanium.
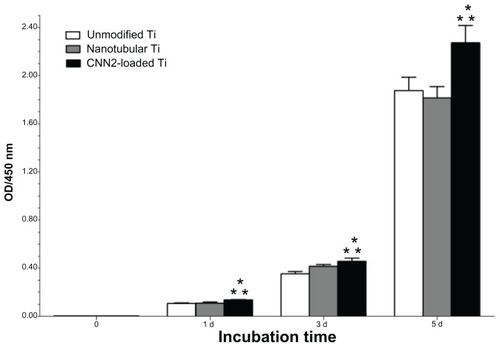
Figure 5 Increased fibroblast adhesion to CCN2 (connective tissue growth factor)-loaded nanotubular titanium.
Notes: n = 6; *P < 0.05 compared to nanotubular titanium; **P < 0.05 compared to unmodified titanium.
Abbreviations: CNN2, connective tissue growth factor; Ti, titanium.
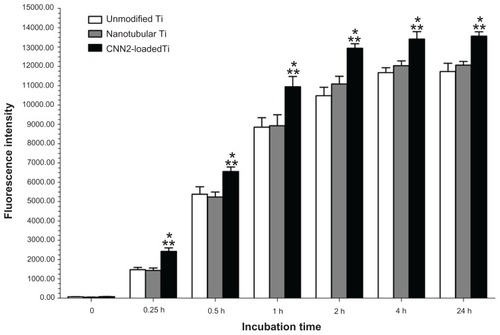
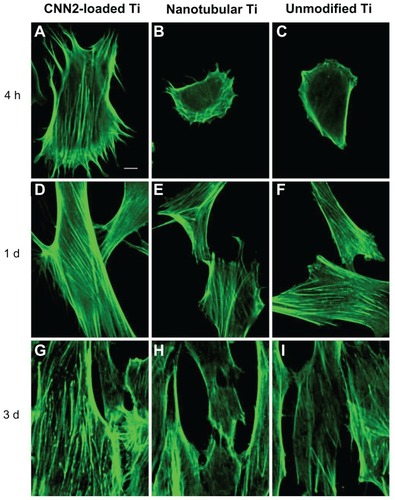
Figure 6 Fluorescent images of actin cytoskeleton among fibroblasts reacting to (A, D, and G) CCN2 (connective tissue growth factor)-loaded nanotubular titanium, (B, E, and H) nanotubular titanium, and (C, F, and I) unmodified titanium surfaces after (A–C) 4 hours, (D–F) 1 day, and (G–I) 3 days.
Note: Bar = 10 μm.
Abbreviations: CNN2, connective tissue growth factor; d, days; h, hours; Ti, titanium.