Figures & data
Figure 1 Ostreolysin marks the presence of cholesterol-sphingomyelin membrane nanodomains along intercellular membrane nanotubes in T24 cells. The labeling of actin filaments highlights the location of intercellular membrane nanotubes (see close up) between T24 (malignant) cells of urothelial origin grown in lipoprotein poor serum medium (A). The addition of ostreolysin reveals specific binding to cholesterol-sphingomyelin membrane nanodomains along the cell surface and along the intercellular membrane nanotubes (B). The growth of T24 cells in lipoprotein poor serum medium treated with 1 mM methyl-β-cyclodextrin for 2-hour causes the formation of actin stress fibers (C) as well as the dispersion of cholesterol-sphingomyelin membrane nanodomains (D). Note that the intercellular membrane nanotubes are still present following the application of methyl-β-cyclodextrin in low concentration (1 mM) (C), and that ostreolysin labeling on the cell surface is much reduced (D).
Abbreviations: LPPS, lipoprotein poor serum; mβCD, methyl-β-cyclodextrin; Oly, ostreolysin.
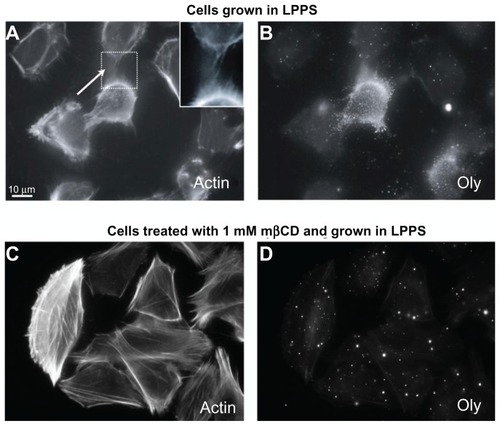
Figure 2 Phase-contrast images of T24 cells revealing the loss of intercellular membrane nanotubes upon increasing concentration of methyl-β-cyclodextrin treatment. The images show the growth of T24 cells in control (A) and cholesterol-free medium (lipoprotein poor serum) (B), and the morphological changes of T24 cells in lipoprotein poor serum following 2–20 mM methyl-β-cyclodextrin 2-hour treatment (C–J). The intercellular membrane nanotubes, observed following 4 mM methyl-β-cyclodextrin treatment, are thinner, longer (C; see arrow), and less frequent than in the control experiment (A; see arrow). The removal of cholesterol from the membrane causes the inward contraction of the cell plasma membrane (D and E). The formation of large vesicular dilations along the intercellular membrane nanotube (E; see arrow) could be due to the curvature mismatch between the remaining membrane components and the tube curvature. Above 6 mM methyl-β-cyclodextrin, the cells become isolated and spherical (F–J).
Abbreviation: mβCD, methyl-β-cyclodextrin.
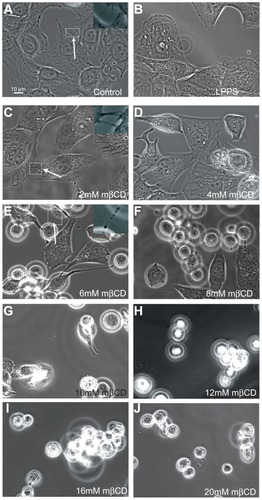
Figure 3 Fluorescence microscope images of T24 cells revealing the integrity of actin filaments and cell nucleus following the growth in cholesterol-free (lipoprotein poor serum) or methyl-β-cyclodextrin treatments. The actin labeling of T24 cells in the control experiment reveals the cell surface ruffling (A). The growth of T24 cells in lipoprotein poor serum causes the smoothing of the cell surface (retraction of the membrane protrusions) as well as the formation of actin stress fibers, which is observed more after 4-hour (C) than 2-hour (B) treatment. The morphological changes in T24 cells following methyl-β-cyclodextrin treatment are similar to the changes observed following growth in lipoprotein poor serum (D and E). Using a DNA label (4′,6-diamidino-2-phenylindole), the integrity of the cell nuclei in the corresponding lipoprotein poor serum and methyl-β-cyclodextrin treatments is revealed (F–J).
Abbreviations: DAPI, 4′,6-diamidino-2-phenylindole; h, hours; LPPS, lipoprotein poor serum; mβCD, methyl-β-cyclodextrin.
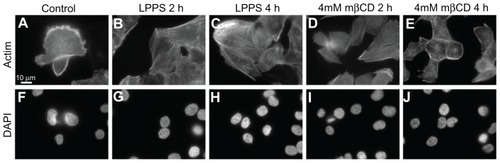
Figure 4 Summary statistics of changes in intercellular membrane nanotube density among T24 cells grown in different growth mediums and following different methyl-β-cyclodextrin concentration treatments. The statistical differences are calculated with respect to the control case. Note that the reduction in intercellular membrane nanotube density becomes significant from 4 mM methyl-β-cyclodextrin 2-hour treatment and highly significant above this concentration.
Note: Data are mean ± standard deviation; *P < 0.05; **P < 0.01.
Abbreviations: ICN, intercellular membrane nanotube; mβCD, methyl-β-cyclodextrin.
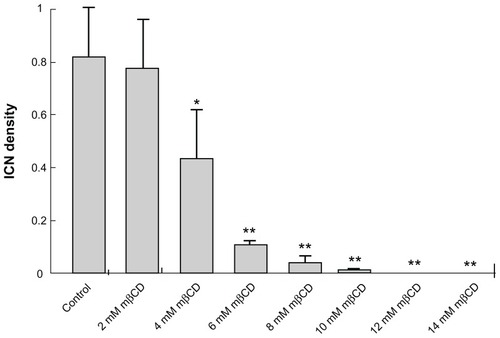
Figure 5 Phase contrast images demonstrating the coupling between intercellular membrane nanotube disconnection and cell separation. At time zero, the T24 cells were treated with 5 mM methyl-β-cyclodextrin. The disruption of intercellular membrane nanotubes was observed using time-lapse confocal microscopy for the indicated times (A). Note that the intercellular membrane nanotube (see inset) is disrupted midway and then retracted. The disconnection of intercellular membrane nanotubes, possibly due to stretching, causes the abrupt cell separation, accompanied by morphological alterations from a polygonal to a spherical cell shape (B).
Note: Scale bar is 10 μm.
Abbreviations: h, hours; ICN, intercellular membrane nanotube; m, minutes; s, seconds.
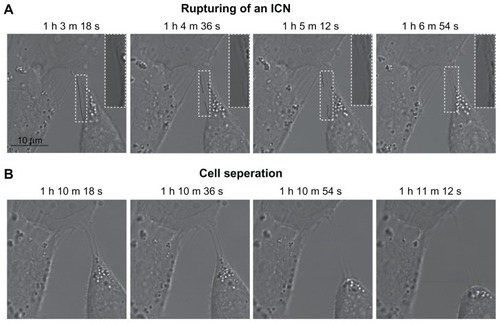
Figure 6 Schematic diagram for the possible effects of methyl-β-cyclodextrin on the curvature of cholesterol-enriched nanodomains. A larger cholesterol content in the outer than in the inner membrane leaflet would increase the local curvature of a membrane region (A). Note that cholesterol depletion from the outer membrane leaflet is predicted to reduce the area difference between the two membrane leaflets. Due to cholesterol short sterol backbone, a cholesterol-phospholipid complex might have a positive spontaneous curvature, which is reduced upon methyl-β-cyclodextrin treatment (B).
Abbreviations: Hm, spontaneous mean curvature of the nanodomain; mβCD, methyl-β-cyclodextrin.
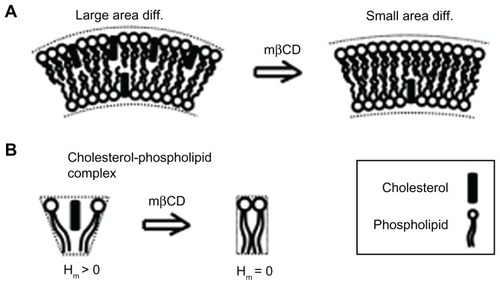
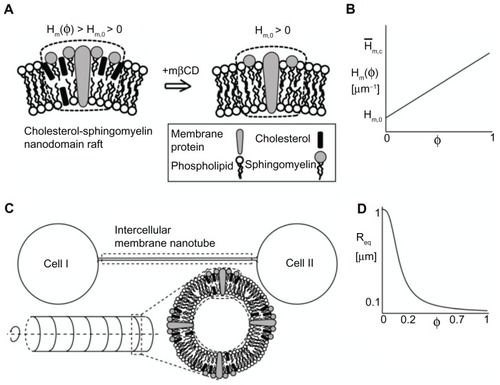
Figure 7 Schematic diagram for the possible model explaining the effects of cholesterol depletion on the intercellular membrane nanotube geometry. A cholesterol-sphingomyelin membrane nanodomain is assumed to have a positive spontaneous curvature, which is reduced following cholesterol depletion (A). A linear relationship is assumed between the spontaneous curvature of the nanodomain and its cholesterol content (B). The same relationship is assumed for the spontaneous membrane curvature deviator. The intercellular membrane nanotube is modeled as an axisymmetric tubular structure, which is composed of cholesterol-sphingomyelin membrane nanodomain of positive spontaneous curvature (C). The equilibrium radius is obtained by the employed linear stability analysis and plotted as a function of cholesterol content (D). Note that cholesterol depletion (φ = 0) favors larger intercellular membrane nanotube radii. The parameter values used are as follows: spontaneous mean (H̄m,0) and deviatoric (D̄m,0) curvature of the cholesterol-free nanodomain = 1 μm−1, spontaneous mean (Hm,c) and deviatoric (Dm,c) curvature of the nanodomain = 25 μm−1, σ = 0.001 g s−2, and membrane bending rigidity κ = 500 kBT, where kB is the Boltzmann constant and T is temperature.
Abbreviations: φ, cholesterol content; Hm(φ), spontaneous mean curvature of the nanodomain; Hm,0, spontaneous mean curvature of the cholesterol-free nanodomain; mβCD, methyl-β-cyclodextrin; Req, equilibrium radius.