Figures & data
Table 1 Levels of the Factors in RSM Design
Figure 1 Synthesis schematic of SPTX@FA@PEG/PEI-SPIONs.
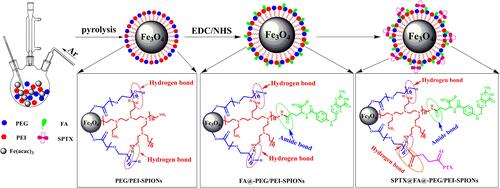
Figure 2 3D response surface diagram for particle size (A1–A3) and EE (B1–B3) of SPTX@FA@PEG/PEI-SPIONs showing interaction between (A1 and B1) X1 and X2; (A2 and B2) X1 and X3; (A3 and B3) X2 and X3.
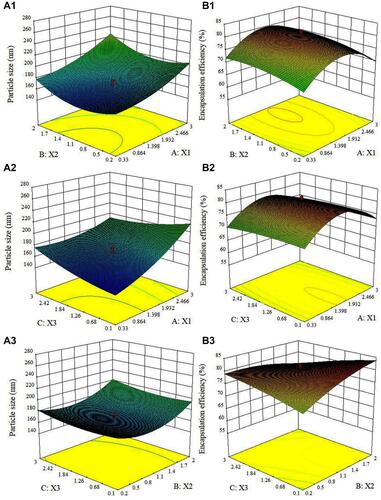
Table 2 Results of Certification Optimization
Figure 3 Particles size (A), zeta potential (B), TEM images and size distributions of PEG/PEI-SPIONs (C1), FA@PEG/PEI-SPIONs (C2), SPTX@FA@PEG/PEI-SPIONs (C3) under optimal conditions.
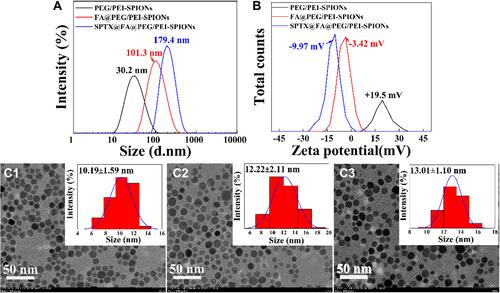
Figure 4 (A) The ultraviolet (UV) and (B) Fourier transform infrared (FTIR) spectra of SPTX@FA@PEG/PEI-SPIONs.
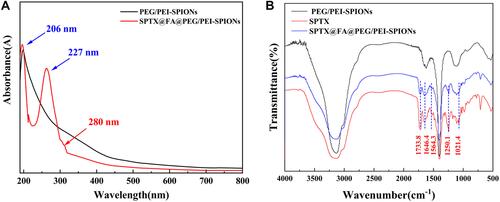
Figure 5 (A) The stability and (B) drug content of SPTX@FA@PEG/PEI-SPIONs in 0.01 mol/L PBS solution, FBS-containing PBS solution (10% FBS) and complete cell culture medium (10% FBS) at 37°C for 72 h (A1 and B1) or at 4°C for 28 days (A2 and B2). Data were represented as mean ± SD (n=3).
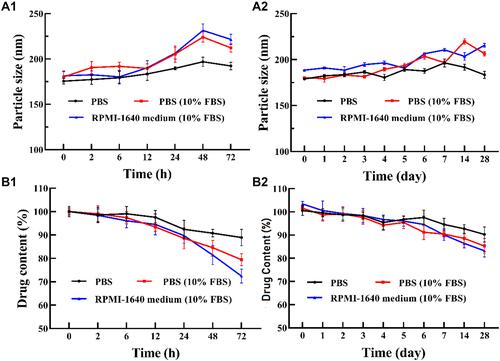
Figure 6 Release profiles of SPTX from SPTX@FA@PEG/PEI-SPIONs at pH 7.3, 6.0 and 5.0, respectively.
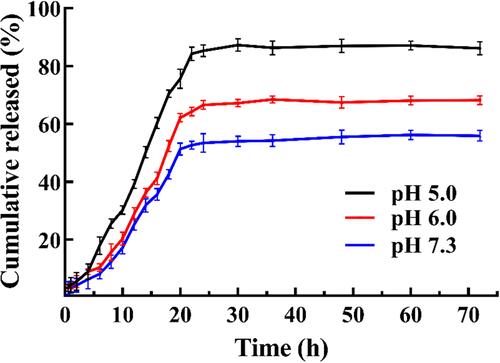
Figure 7 IC50 of PTX and SPTX treated with at 24 h (A) and 48 h (B). Concentration-dependent survival curves of CNE-1 and HNE-1 cells treated by PEG/PEI-SPIONs (C) and FA@PEG/PEI-SPIONs (D) for 24 h. In vitro cytotoxicity of SPTX@FA@PEG/PEI-SPIONs against CNE-1 and HNE-1 cells after treatment for 24 h (E) or 48 h (F). Data were expressed as means ± SD (n=3). *P<0.05, **P<0.01; ##P<0.01; &&P<0.01.
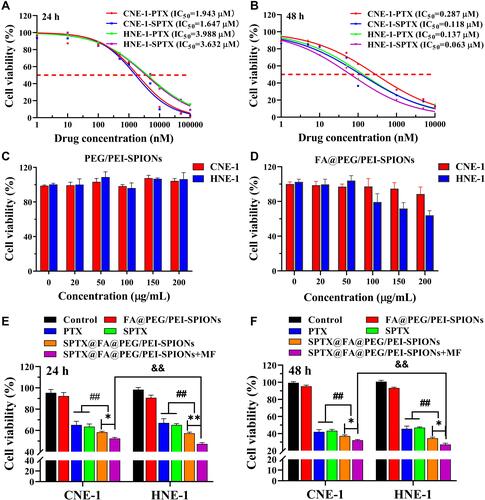
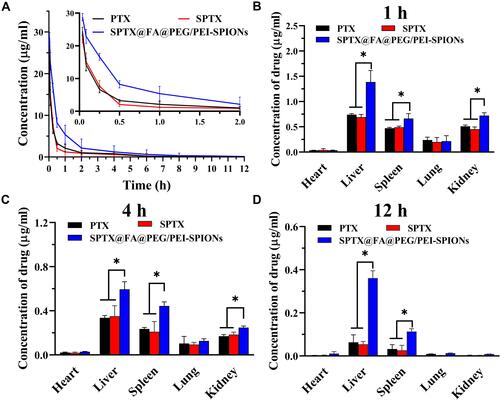
Figure 8 (A) Plasma concentration–time curves of free PTX, SPTX and SPTX@FA@PEG/PEI-SPIONs in vivo, data are expressed as the mean ± SD (n=4). Tissue distributions of free PTX, SPTX and SPTX@FA@PEG/PEI-SPIONs at 1 h (B), 4 h (C) and 12 h (D) post-intravenous injection (n=4), *P<0.05.