Figures & data
Table 1 Composition of Biorelevant Media Used During in vitro Lipolysis
Figure 1 Solubility of rosuvastatin in different oils and surfactants. Each value shows the mean ± SD (n=3).
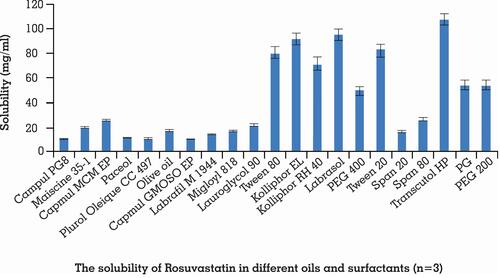
Figure 2 Self-emulsification of different oils with selected surfactants (n=3).
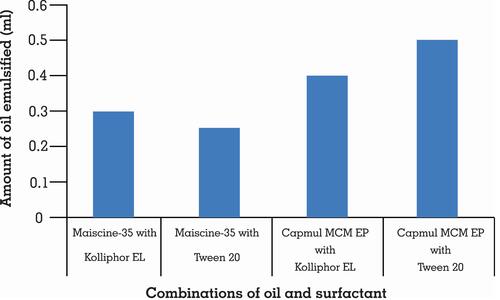
Table 2 Nanoemulsion Region with Different Co-Surfactants
Figure 3 Ternary phase diagram of Capmul MCMEP, tween 20 and transcutol P at Smix ratios (A) 1:1, (B) 2:1, (C) 1:2, and (D) 1:3. The colored region (black) represents nano-emulsion formation region.
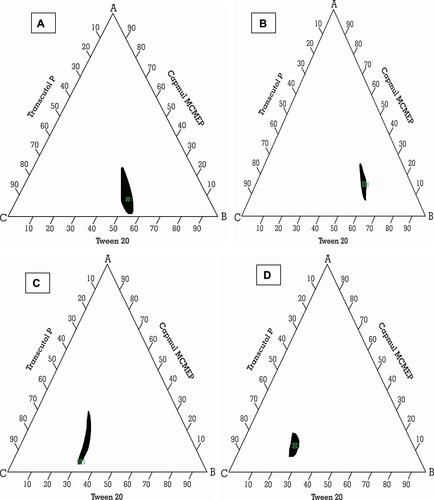
Table 3 Composition of Various SNEDDS Formulations Suggested by Design Expert® and Their Responses
Figure 4 Various 2-D counter plots for response: (A) globule size, (B) % CDR, and (C) self-emulsification time.
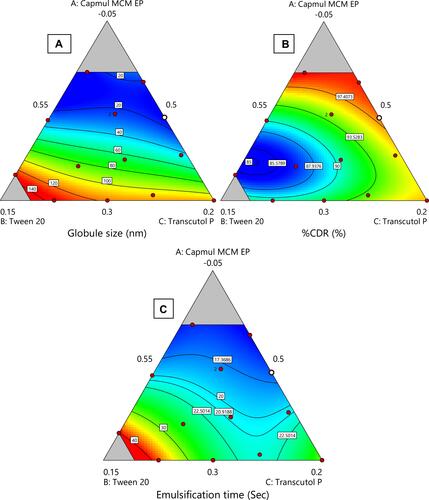
Table 4 Results of ANOVA
Figure 5 Desirability index for optimized rosuvastatin-loaded SNEDDS.
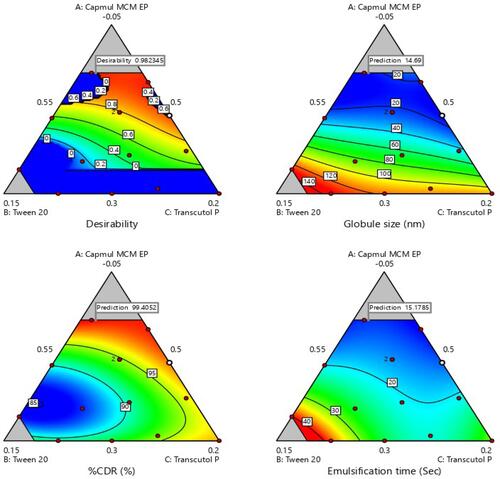
Figure 6 DSC spectra of (A) pure rosuvastatin, (B) physical mixture of drug and excipients, and (C) optimized SNEDDS formulation.
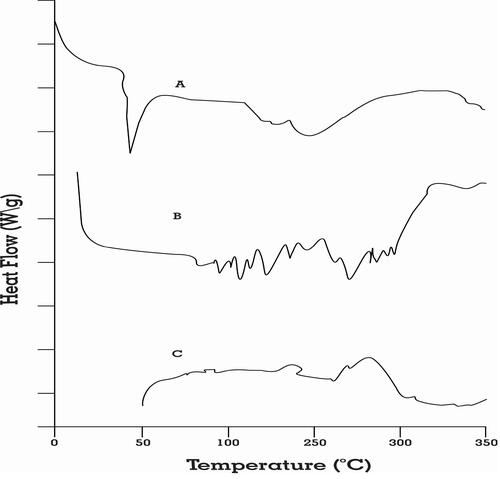
Figure 7 FT-IR spectrum of (A) pure rosuvastatin, (B) physical mixture of drug and excipients, and (C) optimized SNEDDS formulation.
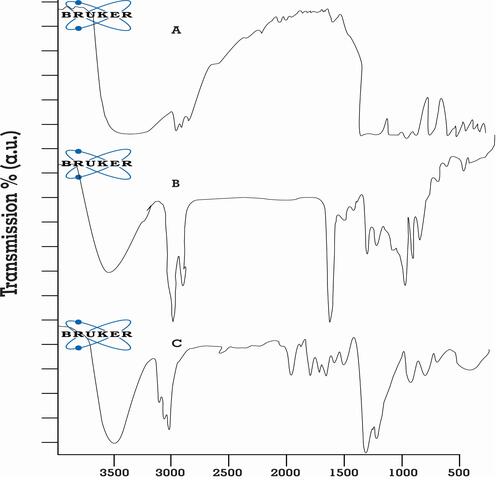
Figure 8 Transmission electron microscopy (TEM) of optimized SNEDDS formulation.
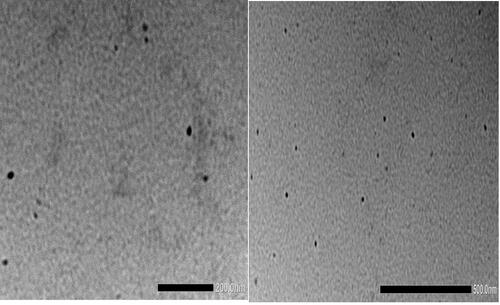
Figure 9 Dissolution (multi-media) testing of rosuvastatin SNEDDS. Each value represents the mean ± SD (n=3).
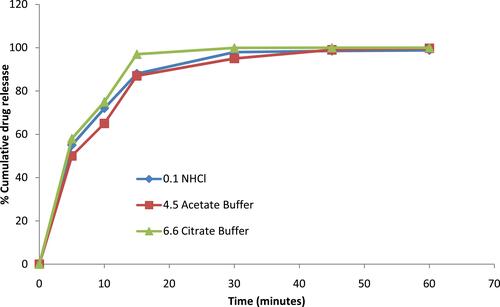
Figure 10 Comparative dissolution study (pH 6.6 citrate buffer) of rosuvastatin-loaded SNEDDS, pure drug and marketed tablet. Each value represents the mean ± SD (n=3).
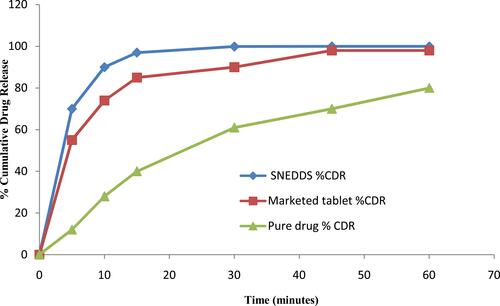
Table 5 Stability Data of Optimized Rosuvastatin SNEDDS Formulation (n=6)
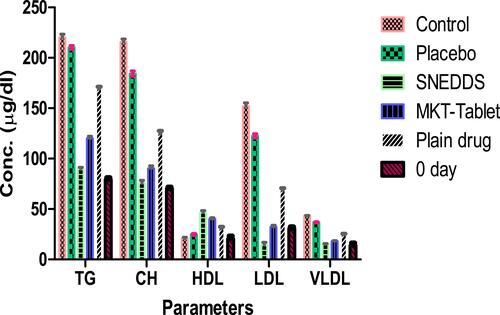
Table 6 Lipid Profile in Experimental Animals with Mean± Std. Deviation (n=6)
Figure 11 Results of comparative lipid profile testing. Each value represents the mean ± SD (n=6).