Figures & data
Figure 1 Percentage of binding of fluorescein isothiocyanate-conjugated R-13 to different cells by flow cytometry analysis.
Notes: Each data point represents the mean ± standard deviation. n = 3, ***P < 0.001.
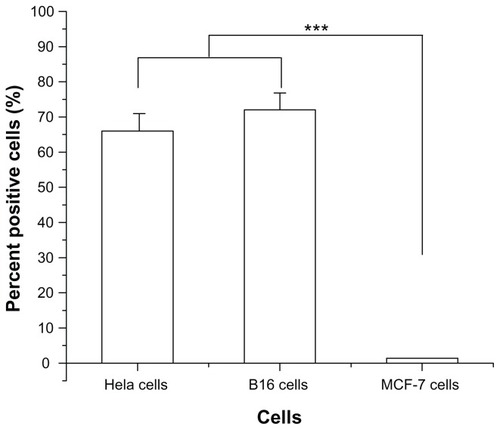
Figure 2 Synthetic scheme of P123-PEI-R13.
Abbreviation: LMW-PEI, low-molecular-weight polyethylenimine.
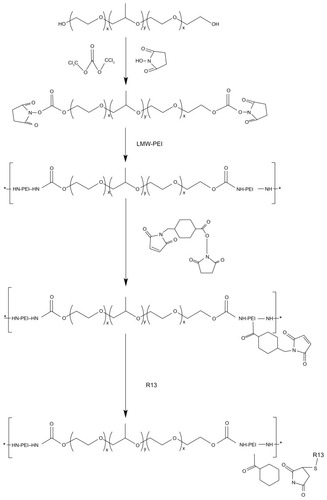
Figure 3 1H- nuclear magnetic resonance spectra of P123-polyethylenimine (PEI) (A) and P123-polyethylenimine-R13 (B) in deuterium oxide at room temperature.
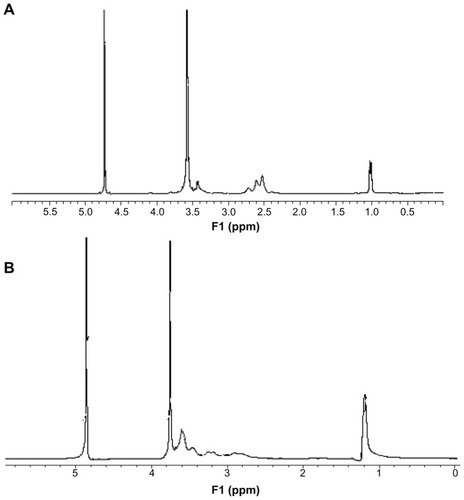
Figure 4 Degradation of P123-polyethylenimine-R13. The polymers were dissolved in 0.1 M phosphate-buffered saline (pH = 7.4) and incubated at 37°C and 100 rpm. Determination of molecular weight (MW) was measured by gel permeation chromatography with multiangle laser light scattering (n = 3).
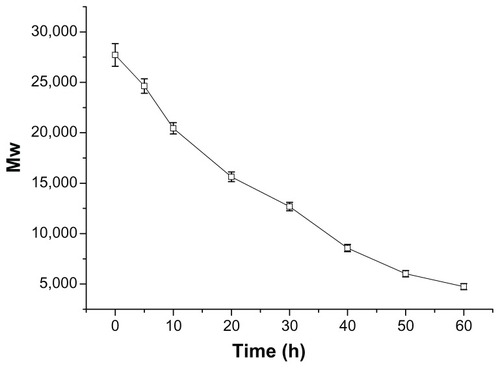
Figure 5 Particle sizes (nm) of P123-polyethylenimine (PEI)-R13/DNA complexes at various w/w ratios.
Note: The data were expressed as mean values (±standard deviations, n = 3).
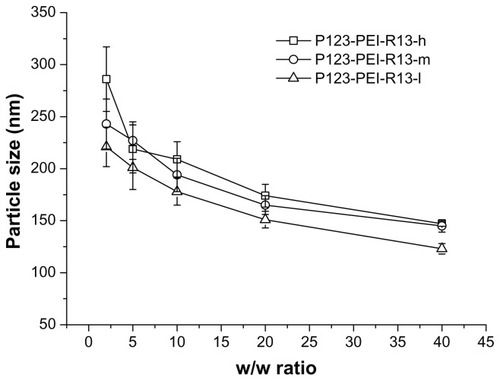
Figure 6 Zeta potential (mV) of P123-polyethylenimine (PEI)-R13/DNA complexes at various w/w ratios.
Note: The data were expressed as mean values (±standard deviations, n = 3).
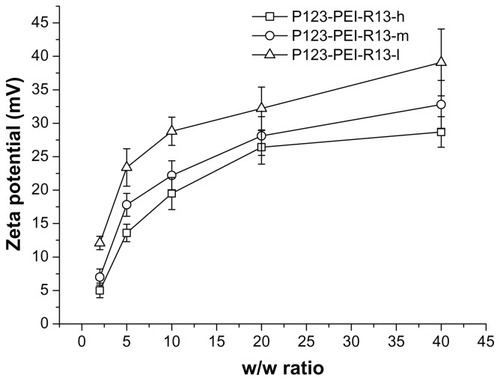
Figure 7 Agarose gel electrophoresis of the complexes at various w/w (P123-polyethylenimine [PEI]-R13/DNA) ratios: (A) P123-PEI-R13-h, (B) P123-PEI-R13-m, and (C) P123-PEI-R13-l.
![Figure 7 Agarose gel electrophoresis of the complexes at various w/w (P123-polyethylenimine [PEI]-R13/DNA) ratios: (A) P123-PEI-R13-h, (B) P123-PEI-R13-m, and (C) P123-PEI-R13-l.](/cms/asset/f18d2ae0-a16e-43c0-b218-09cab01e4ed6/dijn_a_28819_f0007_c.jpg)
Figure 8 Protection of P123-polyethylenimine (PEI)-R13 on plasmid DNA. (A) Protection of plasmid DNA from degradation by DNase I at varying concentrations of 0 DNase I/μg DNA, 0.15 DNase I/μg DNA, 0.375 DNase I/μg DNA, 0.75 DNase I/μg DNA, 1.5 DNase I/μg DNA, 2.25 DNase I/μg DNA, 3 DNase I/μg DNA, 3.75 DNase I/μg DNA, 4.5 DNase I/μg DNA, 5.25 DNase I/μg DNA, 6 DNase I/μg DNA, 6.75 DNase I/μg DNA, and 7.5 U DNase I/μg DNA. (B) Protection of plasmid DNA from dissociation by serum at varying concentrations of 10%, 25%, and 50%. The lanes 10%, 25%, and 50% without “+” refer to the presence of only 10%, 25%, and 50% serum. The lanes 10%, 25%, and 50% with “+” refer to the presence of P123-PEI-R13/DNA complexes at w/w ratio 20 with different concentration of serum. (C) Protection of plasmid DNA from dissociation by sodium heparin at varying concentrations of 0 μg/mL, 120 μg/mL, 140 μg/mL, 160 μg/mL, 180 μg/mL, 200 μg/mL, 220 μg/mL, 240 μg/mL, 260 μg/mL, 280 μg/mL, 300 μg/mL, 400 μg/mL, 500 μg/mL, and 600 μg/mL.
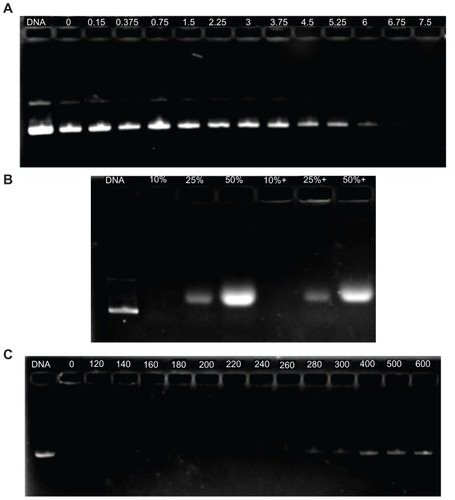
Figure 9 Cytotoxicity of P123-polyethylenimine (PEI)-R13 at various concentrations in Hela cell lines using the 3-(4, 5-dimethylthiazol-2-yl)-2, 5-diphenyl tetrazolium bromide assay.
Notes: Each data point represents the mean ± standard deviation. n = 6, **P < 0.01.
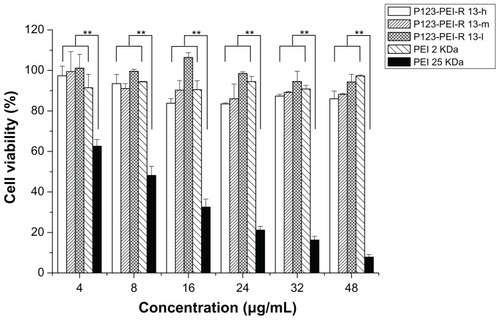
Figure 10 Cytotoxicity of P123-polyethylenimine (PEI)-R13 at various concentrations in B16 cell lines using the 3-(4, 5-dimethylthiazol-2-yl)-2, 5-diphenyl tetrazolium bromide assay.
Notes: Each data point represents the mean ± standard deviation; n = 6, **P < 0.01.
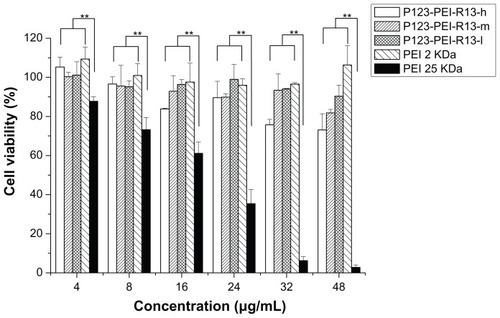
Figure 11 Green fluorescent protein (GFP) reporter gene transfection in Hela cells and B16 cells by P123-polyethylenimine (PEI)-R13. (A) Percentage of GFP transfection in Hela cells by flow cytometry analysis (the mean ± standard deviation, n = 3). (B) Percentage of GFP transfection in B16 cells by flow cytometry analysis (the mean ± standard deviation, n = 6). (C) Representative fluorescence images for the transfection of Hela cells and B16 cells using P123-PEI-R13 at optimal conditions. (D) Microscopic images in bright field of nontransfected cells and transfected cells.
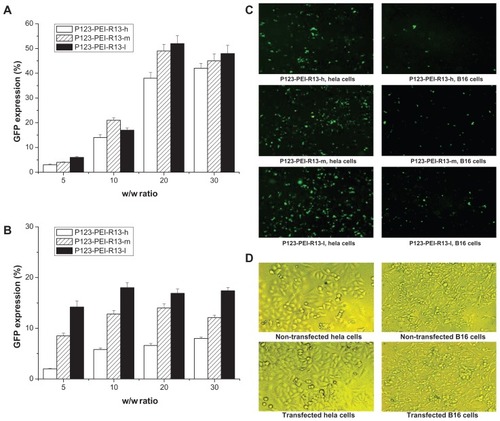
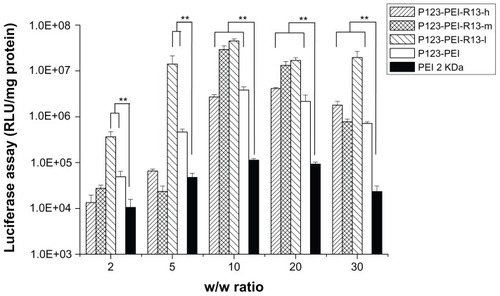
Figure 12 Transfection efficiency of different polymer/DNA complexes at Hela cell line.
Notes: Each data point represents the mean ± standard deviation; n = 6, **P < 0.01.
Abbreviations: PEI, polyethylenimine; RLU, relative light unit.
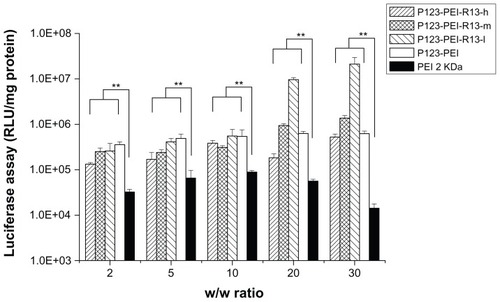
Figure 13 Transfection efficiency of different polymer/DNA complexes at B16 cell line.
Notes: Each data point represents the mean ± standard deviation; n = 6, **P < 0.01.
Abbreviations: PEI, polyethylenimine; RLU, relative light unit.