Figures & data
Figure 1 Formation and structural transitions of nanobubbles for ultrasonic imaging and tumor targeting.
Abbreviations: DPPA, 1,2-dipalmitoyl-sn-glycero-3-phosphate; DPPC, 1,2-dipalmitoyl-sn-glycero-3-phosphocholine; PEG-DSPE, 1,2-distearoyl-sn-glycero-3-phosphoethanolamine- N-[biotinyl(polyethylene glycol)2000].
![Figure 1 Formation and structural transitions of nanobubbles for ultrasonic imaging and tumor targeting.Abbreviations: DPPA, 1,2-dipalmitoyl-sn-glycero-3-phosphate; DPPC, 1,2-dipalmitoyl-sn-glycero-3-phosphocholine; PEG-DSPE, 1,2-distearoyl-sn-glycero-3-phosphoethanolamine- N-[biotinyl(polyethylene glycol)2000].](/cms/asset/66bcd493-3729-4ed4-a670-aefe01216a73/dijn_a_28830_f0001_c.jpg)
Figure 2 Custom-made 2% (w/v) agarose mold for use with in vitro ultrasound imaging and the in vitro experimental setup.
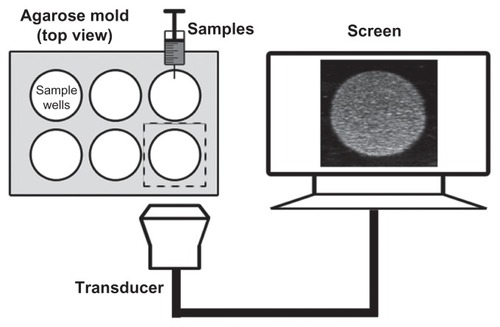
Figure 3 Particle size and morphology of the nanobubbles. The diameter distribution was measured using dynamic light scattering in the nanobubbles (A) and microbubbles (B). The surface morphology of the nanobubbles was visualized using scanning electron microscopy (C).
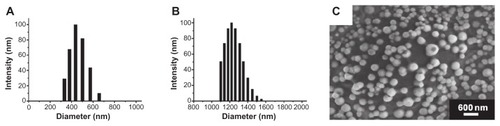
Figure 4 In vitro cytotoxicity of various concentrations of nanobubbles in RM-1 cells determined using the MTT assay. The hemolysis rate of erythrocyte suspensions incubated in the presence of various amounts of nanobubbles.
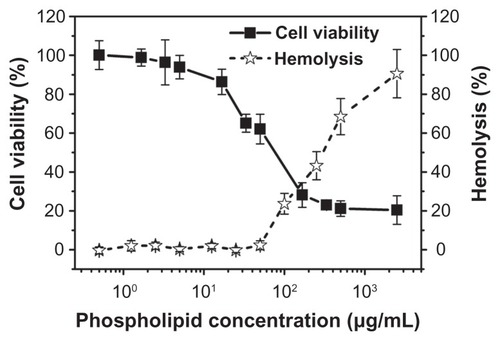
Figure 5 Representative in vitro ultrasonic images (A) of nanobubbles (NBs) and microbubbles (MBs) at high-frequency diagnostic ultrasound in contrast pulse sequencing mode. (B) Quantitative gray-scale ultrasonic intensity (ratio change over gas-free water). The initial gray-scale value was obtained from gas-free water in the sample wells. NBs presented similar gray-scale intensity to MBs at 7 MHz (P = 0.134). (C) Pre- and postdestruction of NBs low-frequency ultrasound exposure.
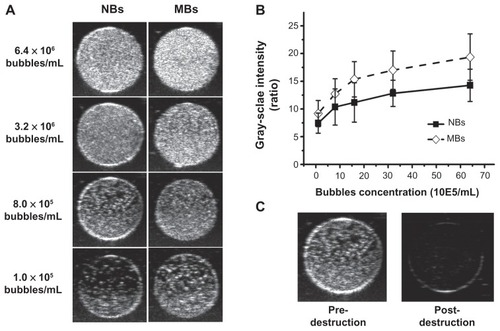
Figure 6 Contrast pulse sequencing-mode images of various organs of normal rats. Images after nanobubble injection (right) showed obvious contrast enhancement in the heart, kidney and liver of Sprague–Dawley rats compared with preinjection images (left).
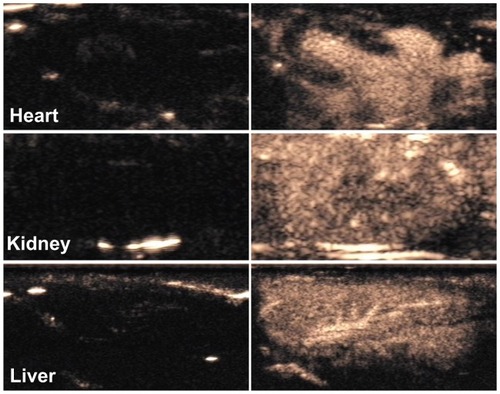
Figure 7 In vivo passive tumor targeting. Representative subcutaneous tumor images before (blue dotted line) and after the injection of nanobubbles (NBs) (A) compared with microbubbles (MBs) (B) at various time points (0, 0.5, 1, 5, 10, and 15 minutes). The corresponding time–intensity curve of tumor enhancement after injection of the contrast agent (C).
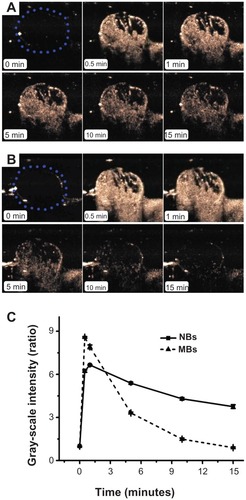
Table 1 Quantitative parameters of NBs and MBs in in vivo tumor ultrasound imaging (mean ± SEM)
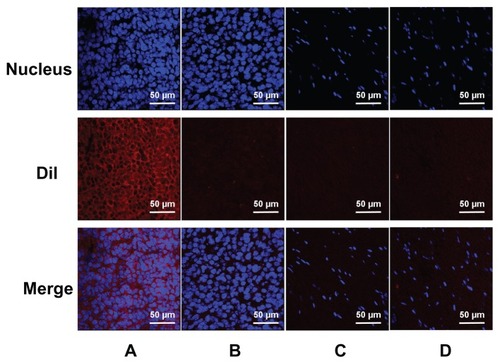
Figure 8 Confocal laser-scanning microscopy images of frozen sections after nuclear labeling. A considerable number of DiI-labeled nanobubbles are observed in the intercellular space (A), whereas DiI-labeled microbubbles are hardly visible in tumors (B). Both DiI-labeled nanobubbles and microbubbles were difficult to detect in skeletal muscle (C and D).