Figures & data
Scheme 1 Schematic illustration of CMCh-BAPE-RGD@ICG for NIR imaging and photothermal therapy of gastric cancer.
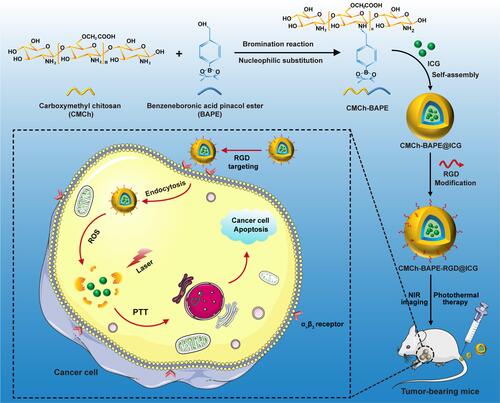
Figure 1 (A) TEM images of CMCh-BAPE-RGD@ICG. (B) Diameter distribution of CMCh-BAPE-RGD@ICG. (C) 1H-NMR of CMCh-BAPE-RGD@ICG. (D) UV-vis absorption spectra and (G) emission spectra of ICG and CMCh-BAPE-RGD@ICG. Changes of absorption and emission spectrum of ICG (E and H) and CMCh-BAPE-RGD@ICG (F and I) in aqueous solution within 48 h.
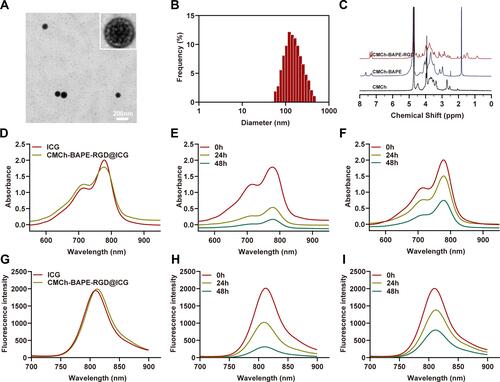
Figure 2 (A) Diameter distribution of CMCh-BAPE-RGD@ICG in the present of H2O2. (B) ROS-responsive leakage assessment of DOX in vitro. (C) Flow cytometry analysis of ROS level. (D) Mean fluorescence intensity from flow cytometry analysis (n=3). (***) P < 0.001.
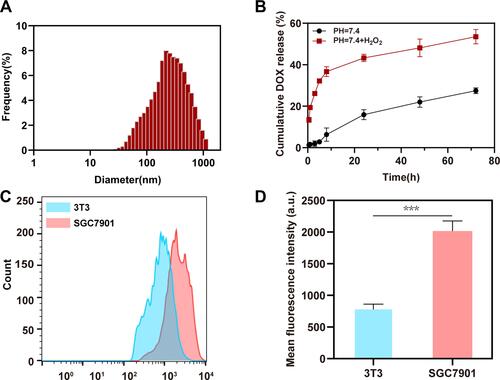
Figure 3 (A) Optothermal heating curve of PBS, ICG, CMCh-BAPE@ICG and CMCh-BAPE-RGD@ICG. (B) Temperature rise profile of CMCh-BAPE-RGD@ICG with different concentrations. (C) Corresponding infrared thermographic images.
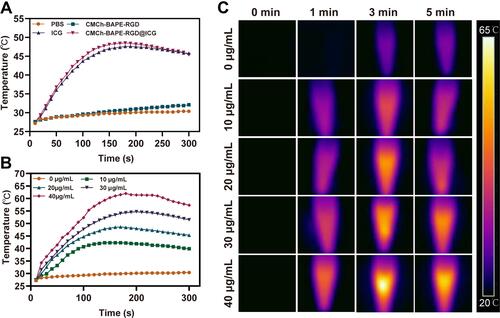
Figure 4 Flow cytometry analysis of ICG and CMCh-BAPE-RGD@ICG by SGC7901 cells at 3 h (A) and 6 h (B). (C) Mean fluorescence intensity from flow cytometry analysis (n=3). (D) Confocal laser scanning microscope images of SGC7901 cells after treated with ICG and CMCh-BAPE-RGD@ICG for 6 h. (*) P < 0.05, (**) P < 0.01 and (***) P < 0.001.
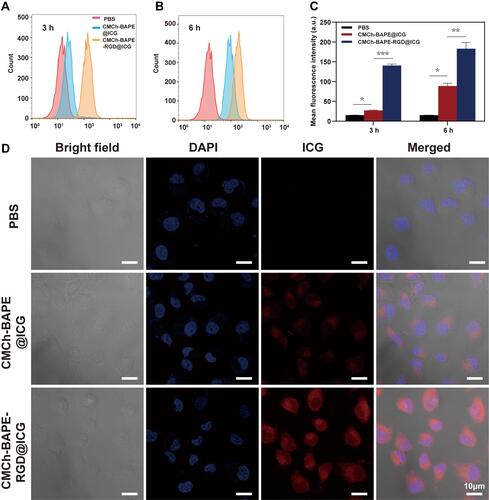
Figure 5 (A) CCK-8 assay of CMCh-BAPE-RGD@ICG on L929 cells with different concentrations. (B) Live/Dead staining imaging of SGC7901 cells after treated with ICG or CMCh-BAPE-RGD@ICG with or without laser irradiation. (C) The viability of SGC7901 cells incubated with CMCh-BAPE-RGD@ICG at different concentrations with or without laser irradiation. (D) SGC7901 cell viability treated with PBS, ICG or CMCh-BAPE-RGD@ICG with or without laser irradiation. (E) Apoptosis analysis of SGC7901 cells received the same treatment as (D) by flow cytometry with Annexin V-FITC/PI double-staining assay. (NS) P ≥ 0.05. (*) P < 0.05, (**) P < 0.01 and (***) P < 0.001.
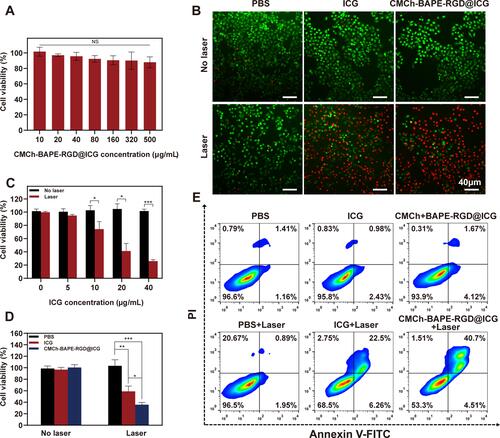
Figure 6 Hemolysis assay (A) and SEM (B) of erythrocytes of CMCh-BAPE-RGD@ICG with different concentrations.
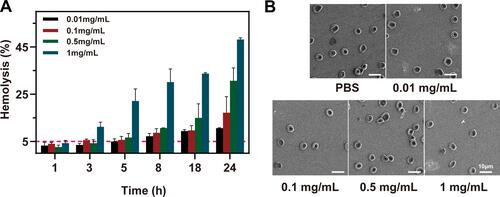
Figure 7 (A) In vivo fluorescent imaging of tumor-bearing mice after intravenous injection of CMCh-BAPE@ICG and CMCh-BAPE-RGD@ICG at indicated time points. (B) Ex vivo fluorescence signal of excised tumors and organs at 8 h after injection.
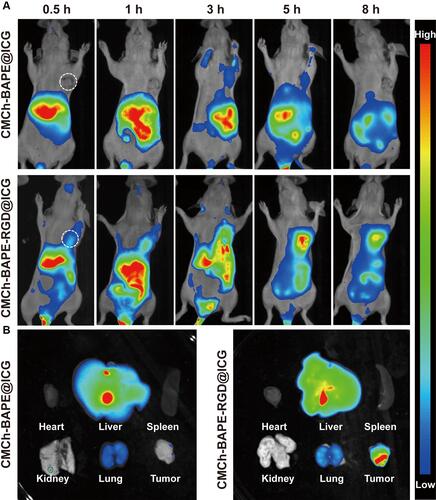
Figure 8 (A) Weight changes curve within 21-day treatments of each group. (B) Tumor growth curve within 21-day treatments of each group. (C) Images of tumor in each group collected on day 21. (D) Average tumor weight in each group after 21-day treatment. (E) Infrared thermographic images of mice received different treatments. (F) H&E, TUNEL and Ki67 staining of tumor sections in each group. Severely damaged tumor tissue are indicated by a black circle. Note that a-f represent different treatments: a.PBS, b.CMCh-BAPE@ICG, c.CMCh-BAPE-RGD@ICG, c.PBS+laser, d. CMCh-BAPE@ICG+laser, e. c.CMCh-BAPE-RGD@ICG +laser. (NS) P ≥ 0.05. (*) P < 0.05, (**) P < 0.01 and (***) P < 0.001.
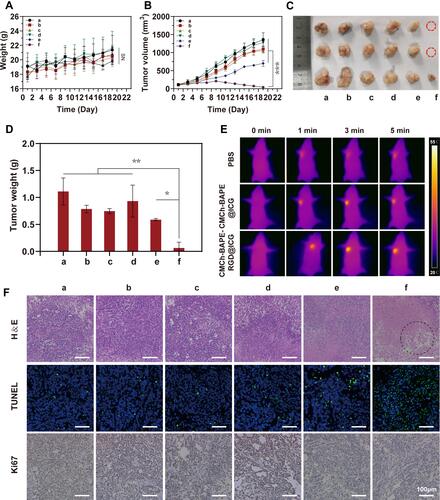
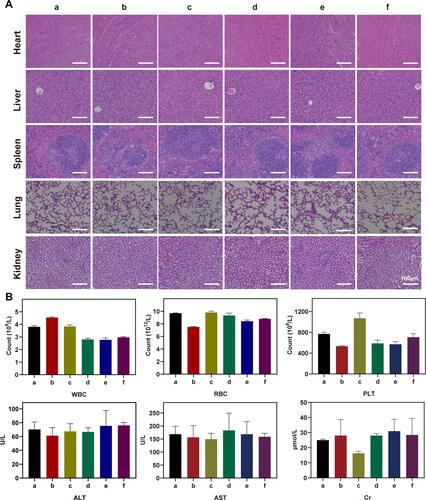
Figure 9 (A) H&E staining images of mice organs after 21-day treatment. (B) Blood parameters for evaluating effects on bone marrow hematopoietic system (RBC, WBC and platelet) and liver (ALT, AST) and kidney (Cr) function. Note that a–f represent the same treatments as .