Figures & data
Figure 1 Synthesis of mPEG–PCL-g–PEI amphiphilic triblock copolymer. (A) indicates the block copolymer mPEG–PCL; (B) indicates a copolymer mPEG–PCL with -C=C- in its end.
Abbreviations: PEG, polyethylene glycol; PCL, poly ɛ-caprolactone; PEI, polyethylenimine.
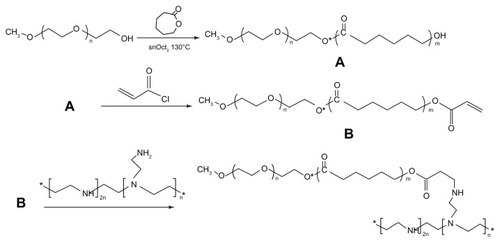
Figure 2 1H-NMR spectra of mPEG–PCL-g–PEI with three different compositions. (A) mPEG–PCL-g–PEI with composition 2000-2000-2000; (B) mPEG–PCL-g–PEI with composition 2000-6000-2000; (C) mPEG–PCL-g–PEI with composition 5000-2000-2000.
Abbreviations: 1H-NMR, proton nuclear magnetic resonance; PEG, polyethylene glycol; PCL, poly ɛ-caprolactone; PEI, polyethylenimine.
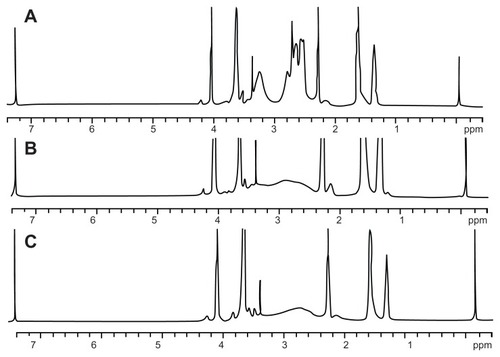
Table 1 Physical chemistry parameters of triblock copolymers
Figure 3 Schematic illustration of self-assembled mPEG–PCL-g–PEI micelles and the capability of drug loading and gene adsorption.
Abbreviations: PEG, polyethylene glycol; PCL, poly ɛ-caprolactone; PEI, polyethylenimine.
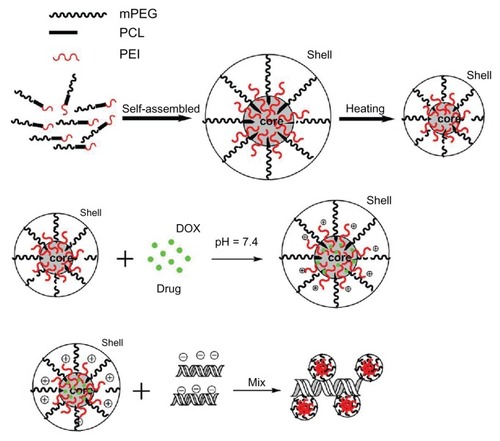
Figure 4 Sizes and zeta potential of the various composition copolymers mPEG– PCL-g–PEI self-assembled at different temperatures.
Abbreviations: PEG, polyethylene glycol; PCL, poly ɛ-caprolactone; PEI, polyethylenimine.
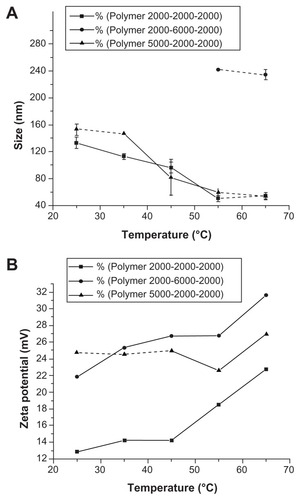
Figure 5 Morphology of mPEG–PCL-g–PEI (5000-2000-2000) nanoparticles determined by transmission electron microscopy (A and B) and atomic force microscopy (C and D). (A) mPEG–PCL-g–PEI blank micelles; (B) micelles containing doxorubicin at a copolymer concentration of 0.5 mg/mL; (C) mPEG–PCL-g–PEI blank micelles; and (D) mPEG–PCL-g–PEI/DNA complexes.
Note: The scale bar is 100 nm.
Abbreviations: PEG, polyethylene glycol; PCL, poly ɛ-caprolactone; PEI, polyethylenimine.
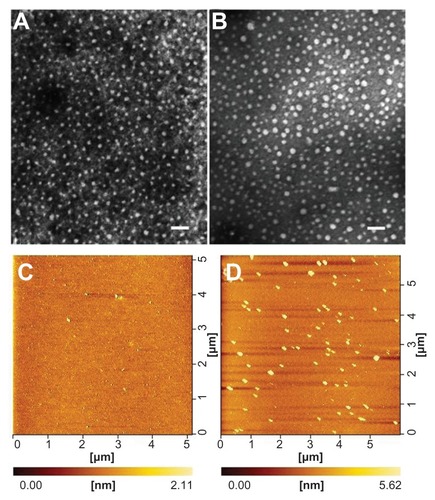
Figure 6 Cytotoxicity of mPEG–PCL-g–PEI nanoparticles of various compositions on (A) L929 cells and (B) HEK293 cells, and cell viability were determined by MTT assay
Notes: Mean ± SD, n = 3. The SD is shown by error bars.
Abbreviations: SD, standard deviation; PEG, polyethylene glycol; PCL, poly ɛ-caprolactone; PEI, polyethylenimine.
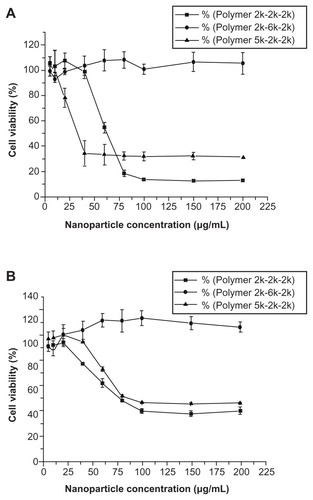
Figure 7 The gene delivery capability of the triblock copolymer were investigated in both B16-F10 and 293T cell lines. The copolymer used was mPEG–PCL-g–PEI with the highest transfection efficiency at a composition of 5000-2000-2000 (A–D and F). (A) Fluorescence microscopy image of 293T cells; (B) white light image in 293T; (C) fluorescence microscopy image in B16-F10 cells; (D) white light image in B16-F10 cells; (E) agarose gel electrophoresis of mPEG–PCL-g–PEI/DNA complexes using three types of composition at various M/M ratios (A is the triblock copolymer with a composition of 2000-2000-2000, while B is 2000-6000-2000, and C is 5000-2000-2000); and (F) percentage of green fluorescence protein expression in B16-F10 cells.
Abbreviations: PEG, polyethylene glycol; PCL, poly ɛ-caprolactone; PEI, polyethylenimine.
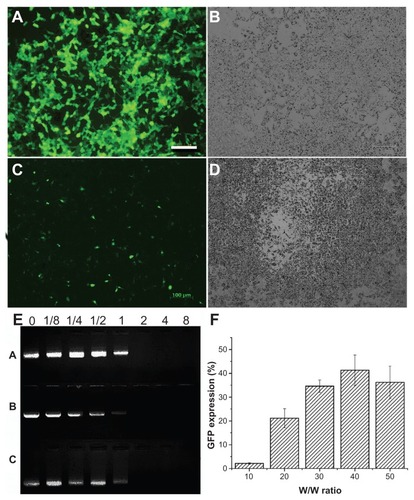
Figure 8 Confocal microscopic images of cellular uptake cocultured with doxorubicin-loaded micelles. The composition of mPEG–PCL-g–PEI copolymer was 5000-2000-2000. (A) Free doxorubicin, 1 hour, (B) free doxorubicin, 4 hours, (C) doxorubicin-loaded micelles, 1 hour, and (D) doxorubicin-loaded micelles, 4 hours.
Note: The scale bar in images is 47.62 μm.
Abbreviations: PEG, polyethylene glycol; PCL, poly ɛ-caprolactone; PEI, polyethylenimine.
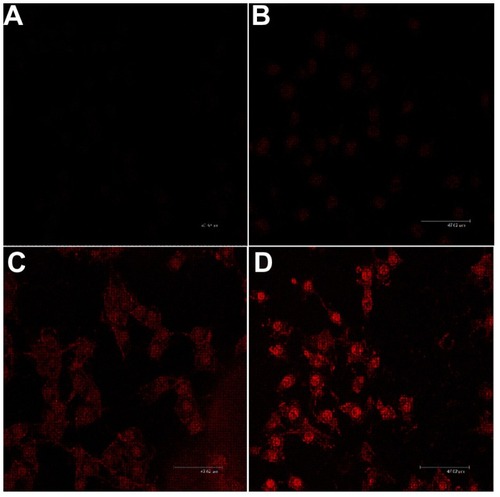
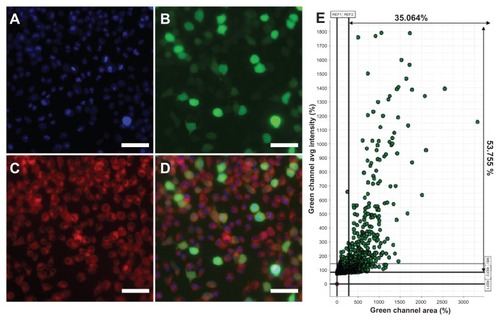
Figure 9 Fluorescence microscopy images of B16-F10 mouse melanoma cancer cells treated with Nile red-loaded micelles/plasmid green fluorescence protein complexes at 37°C. (A) Blue fluorescence (Hoechst 33342) filed, (B) green fluorescence field, (C) red fluorescence (Nile red) field, and (D) merged image. (E) The results were analyzed and indicated more than 35% cells were green fluorescence protein expression.
Note: The scale bar was 20 μm.