Figures & data
Figure 1 Flow-process diagram of the preparation of Radix Sophorae Flavescentis carbonisata-based carbon dots (RSFC-CDs).
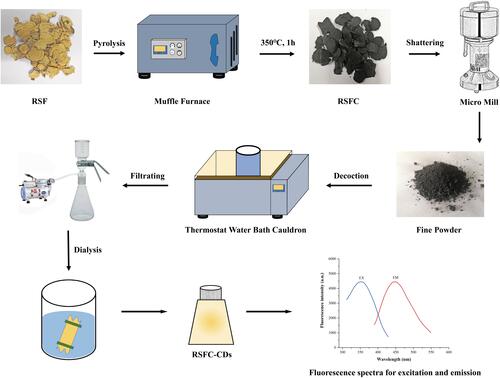
Figure 2 (A) Transmission electron microscope (TEM) image of Radix Sophorae Flavescentis carbonisata-based carbon dots (RSFC-CDs). (B) High-resolution TEM (HRTEM) image of RSFC-CDs. (C) Particle size distribution histogram of RSFC-CDs. (D) X-ray diffraction (XRD) pattern of RSFC-CDs. (E) Ultraviolet-visible (UV-vis) absorption spectrum of RSFC-CDs. (F) Fluorescence spectra for excitation and emission. (G) The excitation-dependent fluorescence spectra of RSFC-CDs. (H) Fourier transform infrared spectroscopy (FTIR) spectrum of RSFC-CDs.
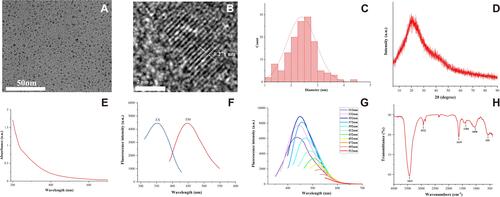
Figure 3 X-ray photoelectron spectroscopy (XPS) spectrum of Radix Sophorae Flavescentis carbonisata-based carbon dots (RSFC-CDs). (A) The full survey spectrum. High-resolution survey spectra of (B) C 1s, (C) O 1s and (D) N 1s.
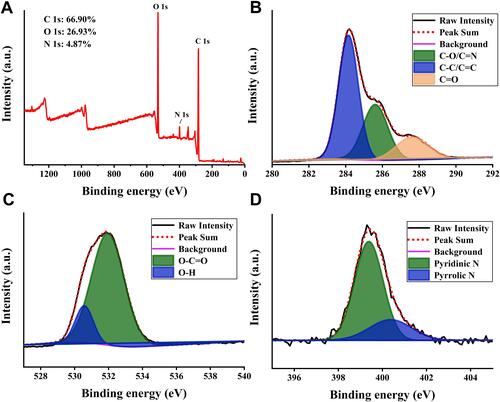
Figure 4 (A) Cytotoxicity analysis in GES-1 cells treated with various concentrations of Radix Sophorae Flavescentis carbonisata-based carbon dots (RSFC-CDs). (B) The protective effect of different concentrations of RSFC-CDs on the ethanol-induced damage model of GES-1 cells.
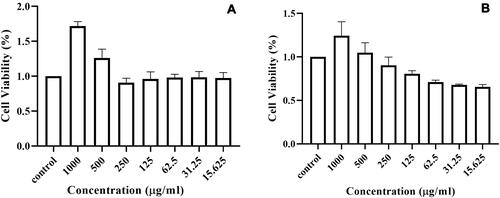
Figure 5 Macroscopic images of Radix Sophorae Flavescentis carbonisata-based carbon dots (RSFC-CDs) ameliorating an ethanol-induced acute gastric mucosal injury. (A) Control group. (B) Model group. (C) Positive group. (D) High-dose RSFC-CDs group. (E) Medium-dose RSFC-CDs group. (F) Low-dose RSFC-CDs group. (G) The ulcer index. (H) Percentage inhibition of each group. Data are expressed as the mean ± SD. ##p < 0.01 compared with the control group, **p < 0.01 compared with the model group.
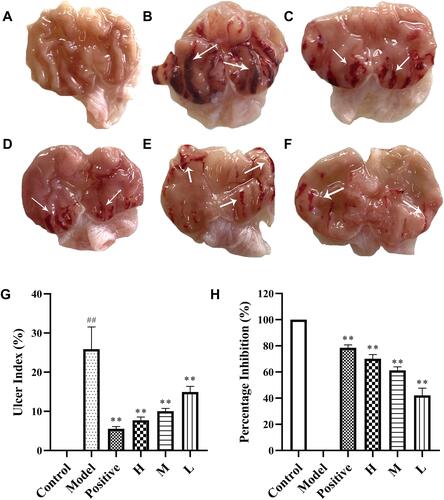
Figure 6 Radix Sophorae Flavescentis carbonisata-based carbon dots (RSFC-CDs) ameliorate ethanol-induced gastric histopathological damage. Histopathological sections of gastric tissue were stained with H&E. The control group (A and D) illustrated the normal structure of the gastric wall with an intact gastric mucosa. The model group (B and E) demonstrated the exfoliation of the mucosal epithelium, haemorrhage, oedema, and inflammatory cell infiltration. Positive (C and F), high-dose (G and J), medium-dose (H and K), and low-dose (I and L) RSFC-CDs groups showed that the gastric injuries had improved to varying degrees.
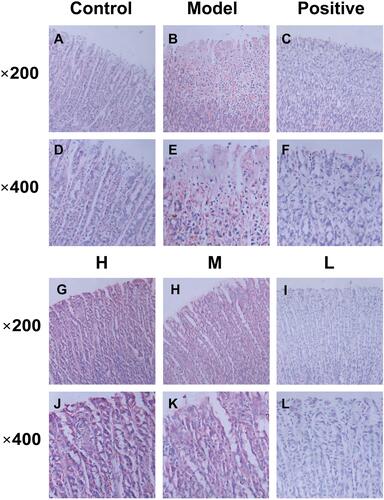
Figure 7 Effects of Radix Sophorae Flavescentis carbonisata-based carbon dots (RSFC-CDs) on the levels of (A) catalase (CAT), (B) superoxide dismutase (SOD), (C) glutathione peroxidase (GSH-Px), (D) glutathione (GSH), (E) malondialdehyde (MDA) and (F) inducible nitric oxide synthase (iNOS) in gastric tissue homogenate supernatant. Data are expressed as the mean ± SD. ##p < 0.01 compared with the control group, *p < 0.05 and **p < 0.01 compared with the model group.
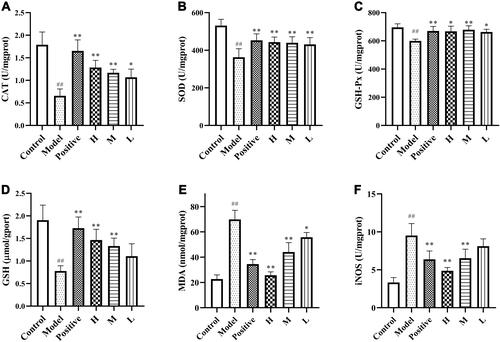
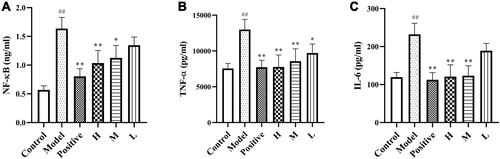
Figure 8 Effects of Radix Sophorae Flavescentis carbonisata-based carbon dots (RSFC-CDs) on the levels of (A) nuclear factor-kappa B (NF-κB), (B) tumour necrosis factor-α (TNF-α), and (C) interleukin (IL)-6 in gastric tissue homogenate supernatant. Data are expressed as the mean ± SD. ##p < 0.01 compared with the control group, *p < 0.05 and **p < 0.01 compared with the model group.