Figures & data
Figure 1 Biotolerability of NPs. RBL cells (15,000/cm2) adherent on cover-slips were incubated with 30 μg of MPS or 75 μg of PS NPs in fresh medium for 48 hours, then the cells were washed and labeled with CellTracker™ (5 μM for 45 min in serum-free medium). After this, the cells were washed and incubated in regular complete medium for 30 minutes. Positive control of toxicity was performed incubating the cells with 1% DMSO. Cells were then washed and imaged under the fluorescence microscope. The proportion of viable (CellTracker™-stained) cells was determined with the aid of ImageJ software. Representative images (A) and quantification (B) of two independent experiments performed in triplicate are shown. Note that almost the whole cell population incubated with either MPS or PS NPs shows intense blue fluorescence, whereas in DMSO-treated culture, most of the monolayer has detached and, of the portion still adherent, approximately 25% of the cells appear faintly labeled with CellTracker™.
Abbreviations: DMSO, dimethyl sulfoxide; MPS, mesoporous silica; NPs, nanoparticles; RBL, rat basophilic leukemia; PS, polystyrene.
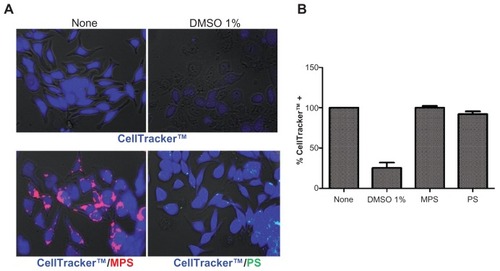
Figure 2 Dose- and time-dependent cellular accumulation of NPs. RBL cells (30,000/cm2) adherent on cover-slips were exposed to different concentrations of NPs for two different incubation times (5 and 30 minutes). After this, the cells were washed, imaged under the fluorescence microscope and cell-associated fluorescence was quantified with ImageJ software. (A) Representative images of RBL cells exposed to PS NPs (concentration and time as indicated). (B) Quantification of total fluorescence (normalized per cell); data from two independent experiments in triplicate are shown. (C) Representative images of cells exposed to MPS NPs.
Abbreviations: MPS, mesoporous silica; NPs, nanoparticles; RBL, rat basophilic leukemia; PS, polystyrene.
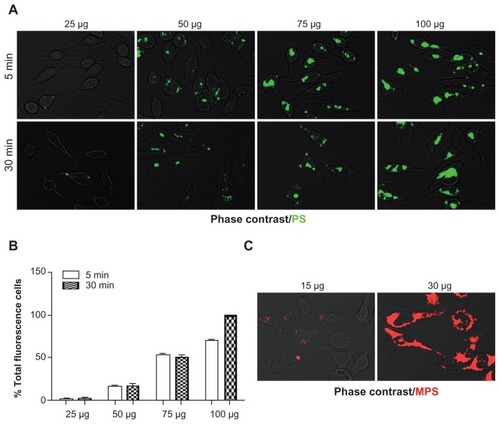
Figure 3 Kinetics of MPS and PS NPs internalization. RBL cells (80,000/well) adherent on 12-well petri dishes were incubated in fresh medium with 10 μg of MPS or 75 μg of PS NPs for the time indicated. At each time point, the cells were washed, harvested and cell-associated fluorescence quantified by flow cytometry.
Note: Data from two independent experiments each performed in triplicate are shown.
Abbreviations: MPS, mesoporous silica; NPs, nanoparticles; RBL, rat basophilic leukemia; PS, polystyrene.
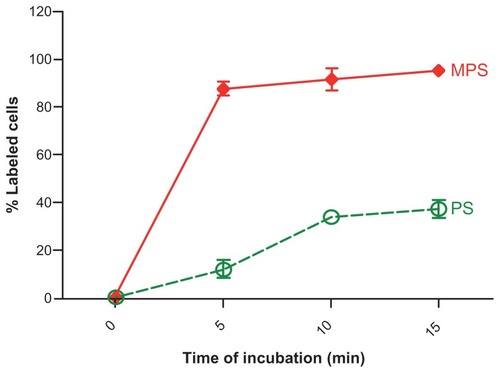
Figure 4 PS NPs induce calcium-regulated exocytosis of PS-containing vesicles. RBL cells (30,000/cm2) adherent on cover-slips were exposed to 75 μg of PS NPs for 15 minutes. Where indicated, the cells were preincubated for 30 minutes with 5 mM EGTA. After this, the cells were washed, imaged under the fluorescence microscope and cell-associated fluorescence was quantified with ImageJ software. (A) Representative images of RBL cells exposed to PS NPs in the presence or absence of EGTA. (B) Quantification of total fluorescence (normalized per cell).
Note: Data from two independent experiments in triplicate are shown.
Abbreviations: EGTA, ethyleneglycoltetraacetic acid; NPs, nanoparticles; RBL, rat basophilic leukemia; PS, polystyrene.
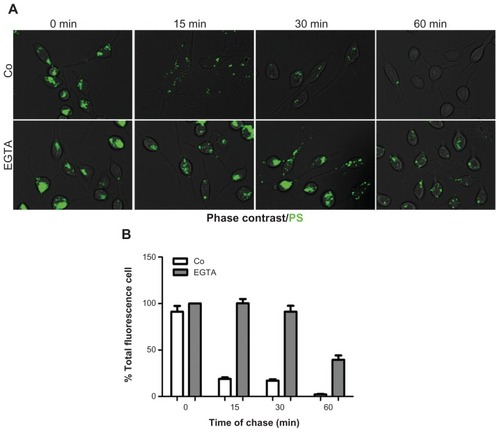
Figure 5 MPS and PS NPs gain access to calcium-regulated secretory compartments. RBL cells (30,000/cm2) adherent on cover-slips were pulse-labeled for 15 minutes with 10 μg of MPS or 75 μg of PS NPs, then cells were washed and incubated for the indicated time in the absence or presence of 1 μM A23187 or 5 mM EGTA, or both. After this, cells were imaged and cell-associated fluorescence quantified with ImageJ software. (A) Representative images of RBL cells incubated with PS NPs and treated as indicated. (B) Representative images of RBL cells incubated with MPS NPs and treated as indicated. (C) Quantification of total fluorescence (normalized per cell).
Note: Data from three independent experiments in triplicate (*P < 0.001) are shown.
Abbreviations: EGTA, ethyleneglycoltetraacetic acid; MPS, mesoporous silica; NPs, nanoparticles; RBL, rat basophilic leukemia; PS, polystyrene.
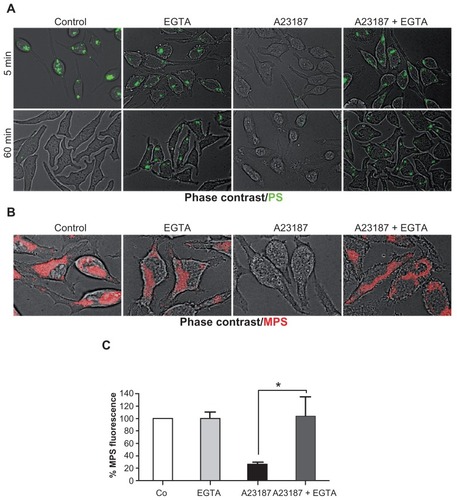
Figure 6 MPS and PS NPs localize to distinct intracellular compartments. (A) RBL cells (30,000/cm2) adherent on cover-slips were co-incubated for 5 minutes with 30 μg of MPS and 75 μg of PS NPs, then cells were washed and imaged at 0, 15, and 60 minutes of chase. Representative images of two experiments in triplicate are shown. (B) RBL cells (10,000/cm2) adherent on cover-slips were transfected (for 6 hours with lipofectamine in Optimem medium) with the plasmid coding for the chimeric fluorescent protein cathepsin D-GFP or cathepsin D-mCherry as indicated. At 36 hours post-transfection, the cells were incubated for 5 minutes with 50 nM LysoTracker™ Red or with 15 μg of MPS or 75 μg of PS NPs, as indicated. Representative images of three independent experiments are shown.
Abbreviations: MPS, mesoporous silica; NPs, nanoparticles; RBL, rat basophilic leukemia; PS, polystyrene.
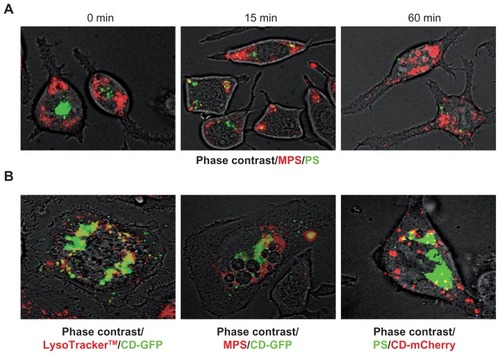
Figure 7 MPS and PS NPs take different endocytic routes. RBL cells (30,000/cm2) adherent on cover-slips were preincubated for 10 minutes with LysoTracker™ (Green or Red), then cells were washed and incubated with NPs and imaged at 1, 5, and 30 minutes. Cell-associated fluorescence was quantified with ImageJ software. Total fluorescence (normalized per cell) was given as a percentage of the individual or mixed color. Representative images of RBL cells incubated with LysoTracker™ green (100 nM) and 10 μg of MPS NPs or with LysoTracker™ Red (50 nM) and 75 μg of PS NPs are shown in (A) and (B), respectively. The intensity of single or mixed fluorescence spots measured in the above samples is shown in (C).
Notes: Data is given as a percentage of the total. Average ± SD of 100 cells randomly chosen. Data from two independent experiments in triplicate are shown.
Abbreviations: MPS, mesoporous silica; NPs, nanoparticles; RBL, rat basophilic leukemia; PS, polystyrene; SD, standard deviation.
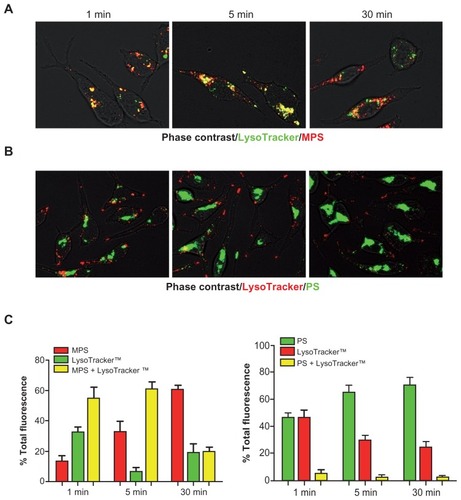
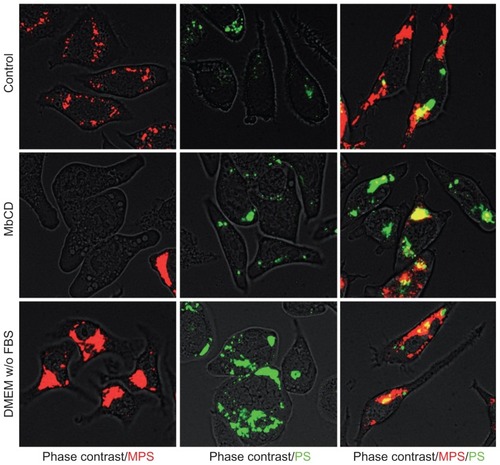
Figure 8 Membrane cholesterol depletion differentially affects endocytosis of MPS and PS NPs. RBL cells (30,000/cm2) adherent on cover-slips were pulse-labeled for 5 minutes with 10 μg of MPS or 75 μg of PS NPs or both in complete or serum-free medium as indicated. Parallel cultures were preincubated for 1 hour, with 5 mM MbCD in serum-free medium used to assess the involvement of cholesterol-dependent mechanisms in the uptake of NPs. After this, cells were washed and imaged under the fluorescence microscope. Representative images of two independent experiments in triplicate are shown.
Abbreviations: MbCD, methyl-β-cyclodextrin; MPS, mesoporous silica; NPs, nanoparticles; RBL, rat basophilic leukemia; PS, polystyrene.