Figures & data
Table 1 Hemolytic activity of cisplatin/cl-micelles and empty cl-micelles against human red blood cells
Table 2 Pharmacokinetic parameter estimates of platinum in plasma for cisplatin or cisplatin/cl-micelle-treated A2780 human ovarian cancer xenograft-bearing female nude miceTable Footnotea
Figure 1 Concentration–time profile of platinum in A2780 human ovarian cancer xenograft-bearing female nude mice.
Notes: Platinum levels were measured following a single intravenous dose of cisplatin/cl-micelles (□) or cisplatin (■) at 7.5 mg cisplatin equivalents/kg body weight, in (A) plasma, (B) tumor, (C) kidney, (D) lung, (E) liver and (F) spleen. Values indicated are means ± standard error of the mean (n = 6), *P < 0.05.
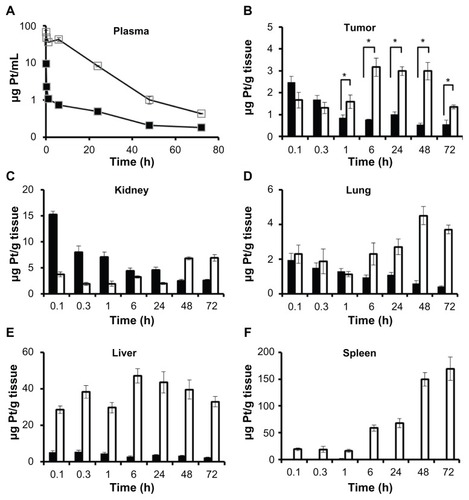
Table 3 Pharmacokinetic parameter estimates in various tissues for cisplatin or cisplatin/cl-micelle-treated A2780 human ovarian cancer xenograft-bearing female nude mice
Figure 2 In vivo efficacy of cisplatin/cl-micelles in A2780 human ovarian cancer xenograft-bearing female nude mice.
Notes: Relative changes in (A) tumor volume and (B) body weight were measured following intravenous administration of cisplatin/cl-micelles (□) or cisplatin (■) at 4 mg cisplatin equivalents/kg body weight. Four administrations were given in total with each administration every fourth day. Control group received 100 μL of 5% dextrose (●). Values indicated are means ± standard error of the mean (n = 6). (C) Kaplan–Meier analysis of overall survival in: (1) control group, (2) cisplatin treatment group, and (3) cisplatin/cl-micelle treatment group.
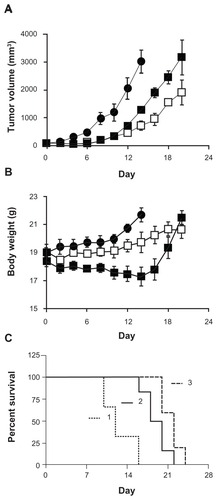
Figure 3 Relative changes in body weight in C57Bl/6 mice.
Notes: (A) Cisplatin was injected intravenously every 4 days, four administrations in total, at a dose of 1 mg/kg (▲), 3 mg/kg (■), and 5 mg/kg (◆). (B) Cisplatin-loaded cl-micelles were injected at identical treatment schedule, at a cisplatin equivalent dose of 3 mg/kg (□), 5 mg/kg (⋄), and 10 mg/kg (○). Dextrose 5% treatment (●) was used as the control. Data are mean ± standard error of the mean (n = 3). Maximum tolerated dose was assumed to be 4 mg/kg in both treatment groups since the animals lost >20% body weight in both groups at the 5 mg/kg dose but did not lose any weight at the 3 mg/kg dose. Cisplatin-loaded cl-micelle treatment at 10 mg/kg resulted in toxic deaths in two animals. The remaining animals had >20% weight loss and were sacrificed by day 5.
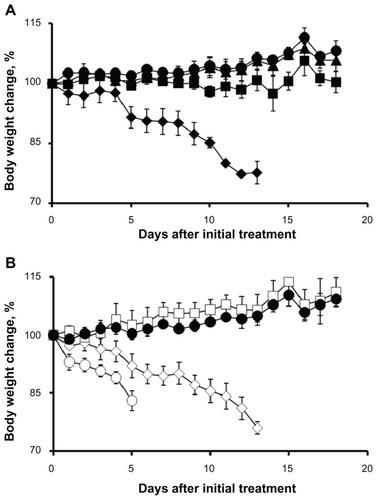
Figure 4 Acute toxicity analysis in female C57Bl/6 mice.
Notes: (A) Changes in body weight (n = 5) until day 13 and day 28 were measured following intravenous administration of cisplatin/cl-micelles (□) or cisplatin (■) at 4 mg/kg. Vehicle control groups received empty micelles 2.5 mg/kg (△) or 100 μL of 5% dextrose (●). Four administrations were given in total with each administration at every fourth day. (B) Plasma BUN concentrations (n = 3–5) at the end of day 13 and day 28 of toxicity analysis. Treatment groups are: (1) control, (2) cisplatin treatment, (3) cisplatin/cl-micelle treatment, and (4) empty micelle treatment. Values indicated are means ± standard error of the mean.
Abbreviation: BUN, blood urea nitrogen.
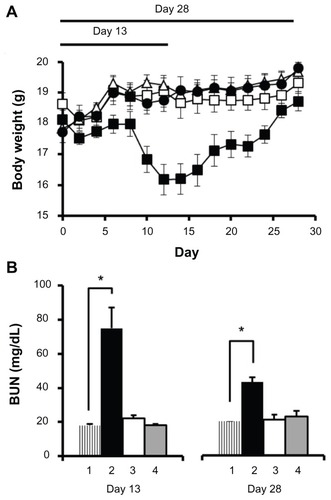
Table 4 Clinical chemistry parameters from female C57Bl/6 mice at day 13 and day 28 of toxicity analysis
Table 5 Tissue weights at sacrifice from female C57Bl/6 mice at day 13 and day 28 of toxicity analysis
Figure 5 Histopathological changes in kidney and bone marrow tissues from toxicity analysis in female C57Bl/6 mice.
Notes: Light microscopy images of hematoxylin and eosin-stained kidney (A–D, day 13; I–L, day 28) and bone marrow (E–H, day 13; M–P, day 28) were taken at a magnification of 200× and 100× respectively. Tissue samples were collected at day 13 and day 28 following intravenous administration of cisplatin/cl-micelles or cisplatin at 4 mg/kg body weight. Vehicle control groups received 2.5 mg free micelles/kg body weight or 100 μL of 5% dextrose. Four administrations were given in total, each administration performed every fourth day.
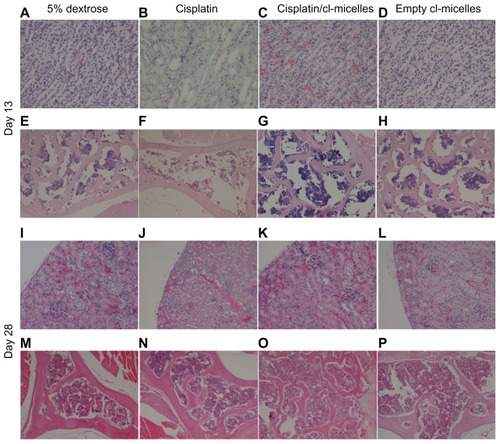
Figure 6 Light microscopy images (original magnification 100×) of hematoxylin and eosin-stained liver and spleen tissues from toxicity analysis in female C57Bl/6 mice.
Notes: No histopathological changes were observed in liver (A and B, day 13; E and F, day 28) and spleen (C and D, day 13; G and H, day 28) following administration of free cisplatin at a dose of 4 mg/kg, cisplatin-loaded cl-micelles at a cisplatin equivalent dose of 4 mg/kg, or empty micelles at 2.5 mg polymer/kg body weight. Treatment was administered by bolus intravenous tail vein injection (n = 5), four treatments in total, with each treatment at a 4-day interval. The animals were sacrificed using CO2 euthanasia on day 13 and day 28 for toxicity analysis. Hematoxylin and eosin staining was performed as described in materials and methods.
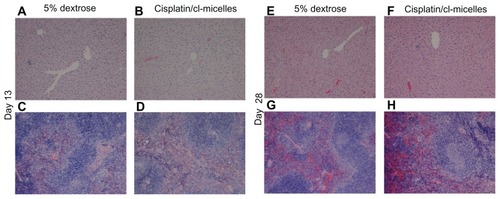
Figure 7 Immunohistochemistry images of PEG stained tissues from acute toxicity analysis in female C57Bl/6 mice.
Notes: No accumulation was observed in the kidney (magnification 200×) from either cisplatin-loaded (A, cortex; B, tubules) or empty micelles (C, cortex; D, tubules) treatment groups. Liver (E–F, cisplatin/cl-micelles; G–H, empty micelle) and spleen (I–J, cisplatin/cl-micelles; K–L, empty micelle) showed strong accumulation of micelles (magnification 200×/400×). Spleen shows accumulation of micelles only in the red pulp region.
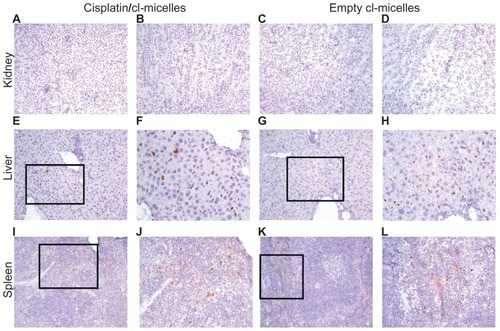
Figure 8 Uptake of cisplatin/cl-micelles by macrophages.
Notes: Female nude mice (n = 3) bearing A2780 ovarian cancer xenografts (approximately 800 mm3), administered a single intravenous tail vein injection of free cisplatin or cisplatin/cl-micelles (7.5 mg/kg), or empty micelles (20 mg polymer/kg body weight) were sacrificed 24 hours post-treatment and liver, spleen, and tumors were harvested for flow cytometric analysis. Staining was performed with anti-CD14 antibody and anti- PEG antibody as described in material and methods. (A) Relative population of CD14 positive cells amongst the treatment groups was similar. (B) and (C), majority of the PEG positive cells in the micelle treatment group liver and spleen costained for mouse CD14 (70%–80%), indicating macrophage uptake of micelles in these organs. Tumor had two distinct populations of cells with about 30%–40% of PEG positive cells costaining for CD14 while the remaining associated with other tumor cells.
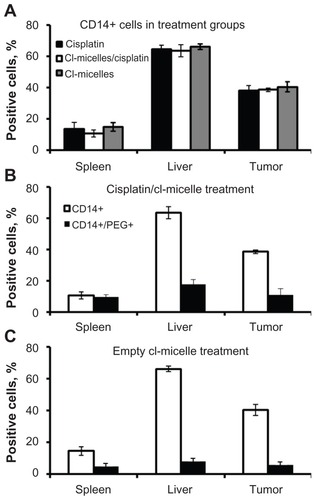
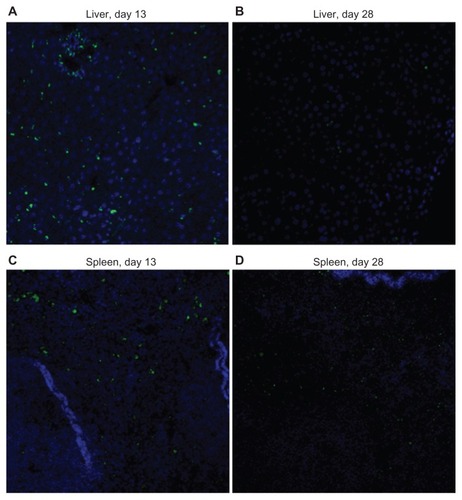
Figure 9 Immunofluorescence images (original magnification 200×) of liver and spleen tissues from toxicity analysis in female C57Bl/6 mice.
Notes: Slide mounted sections (5 μm) of liver (A, day13; B, day 28) and spleen (C, day 13; D, day 28) following administration of cisplatin-loaded cl-micelles at a cisplatin equivalent dose of 4 mg/kg were stained for PEG (anti-PEG antibody, green) and nuclei (4′,6-diamidino-2-phenylindole, blue). Significant decrease in PEG staining in day 28 tissues was seen relative to corresponding day 13 tissues. Treatment was administered by bolus intravenous tail vein injection (n = 5), four treatments in total, with each treatment at a 4-day interval. The animals were sacrificed using CO2 euthanasia on day 13 and day 28 for toxicity analysis.
Abbreviation: PEG, poly(ethylene glycol).