Figures & data
Figure 1 Synthetic scheme of GT–SPE polyspermine.
Abbreviations: GT, glycerol triacrylate; SPE, spermine; PEA,.
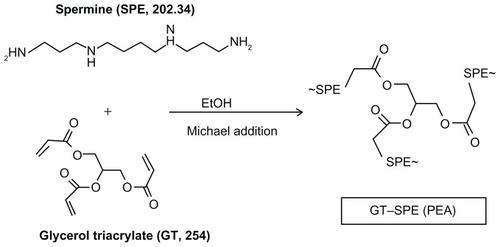
Figure 2 In vivo gene transfer analysis after aerosol delivery to lungs. (A) Transfection efficiency study: GFP expression analysis (Magnification, 200×). (B) Lung histopathology study: H&E staining (Magnification, 200×; scale bar, 50 μm).
Abbreviations: GFP, green fluorescent protein; GT–SPE, glycerol triacrylate–spermine; H&E, hematoxylin and eosin.
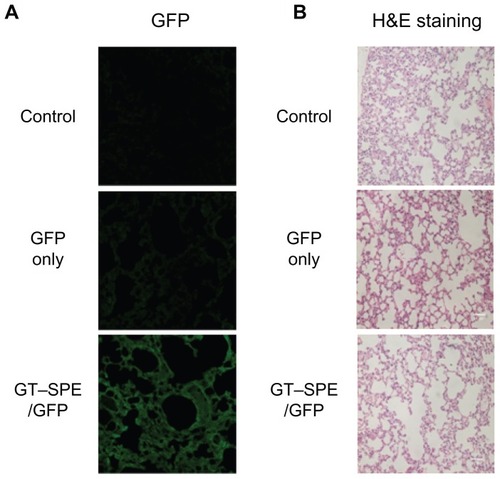
Figure 3 Therapeutic efficiency of GT–SPE as an aerosol gene delivery carrier in lung cancer model K-rasLA1 mice. Aerosol delivery of GT–SPE/Akt1 shRNA significantly inhibited lung tumor numbers and tumorigenesis. (A) Lung tumor lesions. (B) Total tumor numbers (n = 4, **P <0.01 compared to shAkt1 only, GT–SPE/Scr, and control). (C) Tumor size over 1 mm; tumor numbers (n = 4, *P <0.05 compared to control; **P < 0.01 compared to shAkt1 only; ***P < 0.001 compared to GT–SPE/Scr). (D) Histopathological features (Magnification, 200×).
Abbreviations: GT–SPE, glycerol triacrylate–spermine; MMP-9, matrix metalloprotease-9; PCNA, proliferating cell nuclear antigen; shAkt1, small hairpin Akt1.
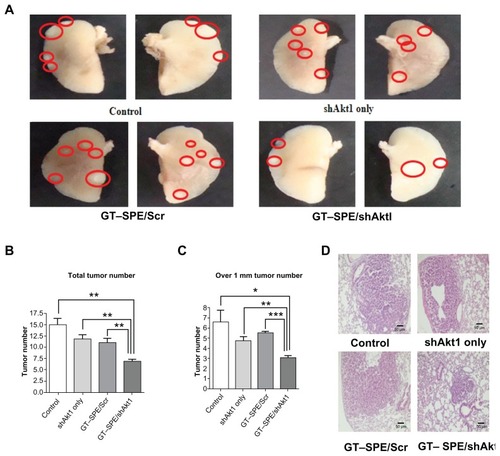
Figure 4 shAkt1 aerosol delivery significantly decreased Akt1 expression level and induced apoptosis. (A) Western blot bands. Statistical analyses of Western blot (B) Akt1, (C) Bax, and (D) Bcl-xL. Bands were analyzed by densitometer (n = 4, *P < 0.05, **P < 0.01, and ***P < 0.001 compared to shAkt1 only, GT–SPE/Scr, and control).
Abbreviations: con, control; GT–SPE, glycerol triacrylate–spermine; shAkt1, small hairpin Akt1.
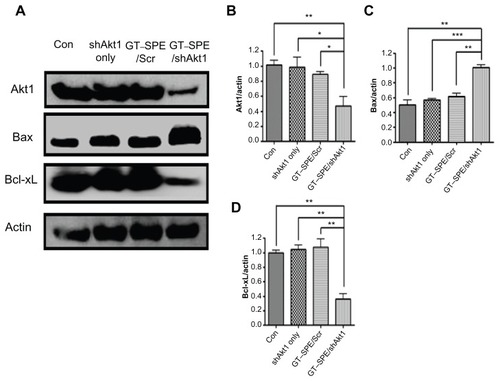
Figure 5 GT–SPE/shAkt1 induced cell cycle arrest and inhibited proliferation. (A) Western blot bands of Cyclin B1 and PCNA, (B) Cyclin B1, and (C) PCNA. Bands were analyzed by densitometer (n = 4, *P < 0.05, **P < 0.01, and ***P < 0.001 compared to shAkt1 only, GT–SPE/Scr and control). (D) PCNA immunohistochemistry analysis (Magnification, 200×; scale bar, 50 μm).
Abbreviations: con, control; GT–SPE, glycerol triacrylate–spermine; PCNA, proliferating cell nuclear antigen; shAkt1, small hairpin Akt1.
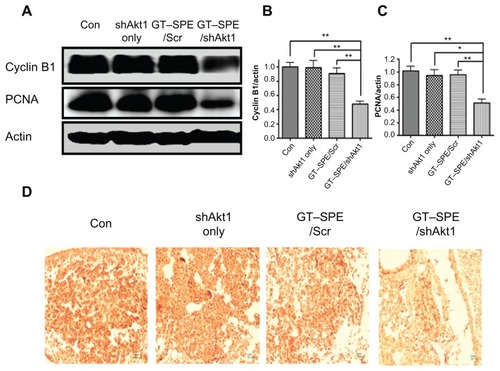
Figure 6 Repeated aerosol delivery of GT–SPE/shAkt1 decreased MMP-9 activity and angiogenesis. (A) Western blot bands of MMP-9, VEGF, and CD31. (B) MMP-9, (C) VEGF, (D) CD31. Bands were analyzed by densitometer (n = 4, *P < 0.05, **P < 0.01, and ***P < 0.001 compared to shAkt1 only, GT–SPE/Scr, and control). (E) VEGF and CD31 immunohistochemistry (Magnification, 200×; scale bar, 50 μm).
Abbreviations: GT–SPE, glycerol triacrylate–spermine; MMP-9, matrix metalloprotease-9; shAkt1, small hairpin Akt1; VEGF, vascular endothelial growth factor.
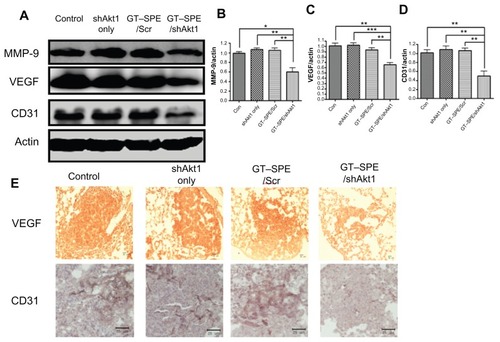
Figure S1 Characterizations of GT–SPE polyspermine. (A) 1H NMR spectra of GT–SPE. (B) GPC analysis of GT–SPE.
Abbreviations: GPC, gas permeability chromatography; GT–SPE, glycerol triacrylate–spermine; 1H NMR, proton nuclear magnetic resonance; PDI, polydispersity index.
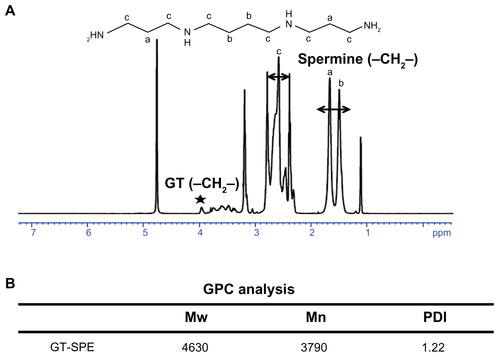
Figure S2 Characterizations of GT–SPE/DNA complexes. (A) Agarose gel electrophoresis of GT–SPE/DNA complexes at various weight ratios of the complexes. (B) DNA protection and release assay. (C) EF-TEM images of GT–SPE/DNA complexes. (D) Size distribution assay. (E) Particle surface charges of copolymer/DNA complexes.
Abbreviations: EF-TEM, energy-filtered transmission electron microscopy; GT–SPE, glycerol triacrylate–spermine.
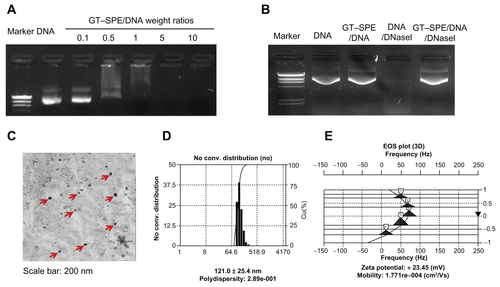
Figure S3 Cytotoxicity of GT–SPE copolymer at various concentrations in different cell lines. (A) A549, (B) HepG2, (C) MCF7, and (D) 16HBE14o- (mean ± SD, n = 3).
Abbreviations: GT–SPE, glycerol triacrylate–spermine; PEI, polyethylenimine; SD, standard deviation.
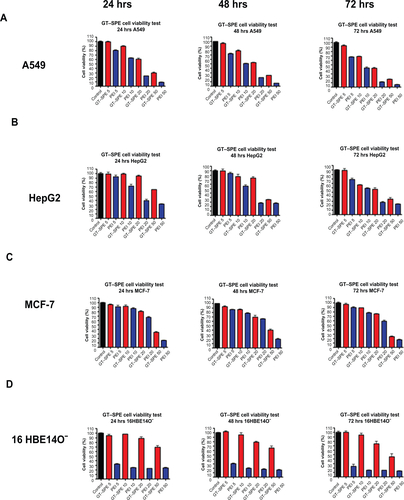
Figure S4 In vitro transfection studies. (A) Transfection efficiency study in A549 cells by GT–SPE/DNA (pGL3) complexes at various weight ratios (mean ± SD, n = 3). (B) Buffering capacity study of GT–SPE/DNA complexes in A549 cells (mean ± SD, n = 3).
Abbreviations: con, control; GT–SPE, glycerol triacrylate–spermine; PEI, polyethylenimine; SD, standard deviation.
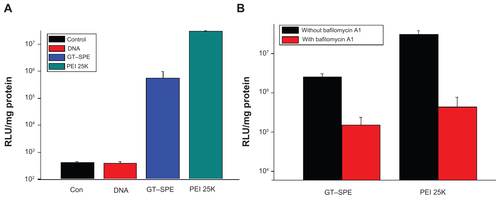
Figure S5 In vivo GFP analysis in different organs after aerosol administration.
Abbreviations: GFP, green fluorescent protein; GT–SPE, glycerol triacrylate–spermine.
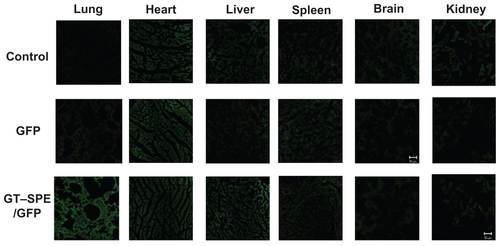
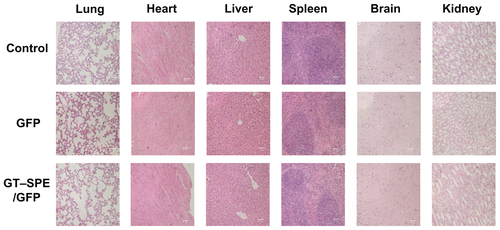
Figure S6 In vivo H&E staining in different organs after aerosol administration (magnification: 200×).
Abbreviations: GFP, green fluorescent protein; GT–SPE, glycerol triacrylate–spermine; H&E, hematoxylin and eosin.