Figures & data
Figure 1 Schematic diagram of channel in polymethylmethacrylate chip – containing tissue-mimetic gel scaffold with an adjacent vessel inlet well, where nanoparticle solutions are loaded for imaging under fluorescent microscopy; fluorescent microparticles are substituted for the physical barriers of live cells. Imaging allows for time-lapse tracking of diffusive nanocarrier flow profiles from the vessel inlet through the tissue scaffold.
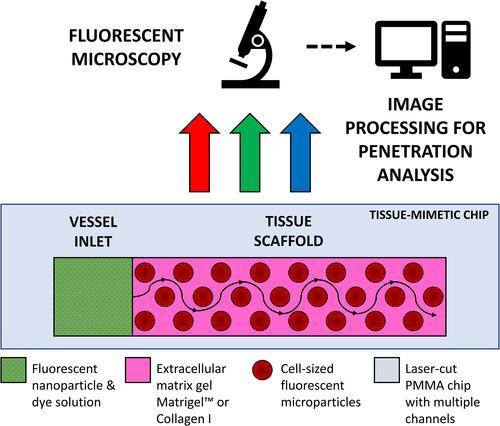
Figure 2 Schematic overview of gel loading steps: (A) assembled device prior to gel loading, (B) empty channel with plug, (C) pipetting ECM gel into channel, (D) gelation under incubation, (E) removal of the PMMA plug to form an empty inlet, and (F) loading of the nanoparticle solution (NPs).
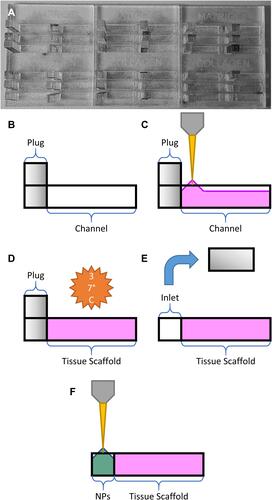
Figure 3 Graphical output of automated image analysis, showing (A) initial fluorescent image, (B) data preparation including conversion to 1D intensity profile, (C) averaging, selection of region of interest, and re-scaling (D) the final thresholding procedure. Both the region of interest (white dashed lines) and threshold intensity positions (red dashed lines) are marked on the fluorescent image.
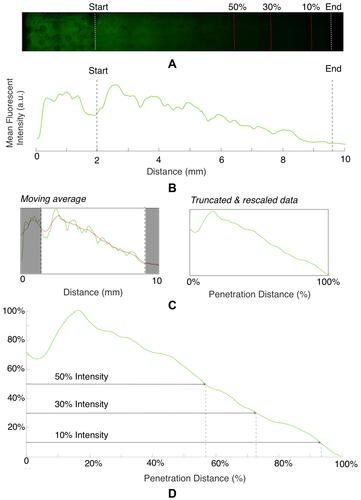
Figure 4 Time series data from example channels, showing tissue penetration of fluorescein dye and 20 nm particles in different tissue scaffold conditions (gel type vs presence of microparticles). Images represent penetration at time = 0 h, 4 h and 8 h. Boundaries of tissue scaffold location and channel end is denoted between dotted white lines.
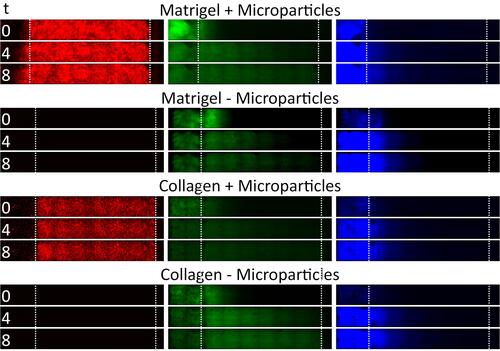
Figure 5 Timescale data for all conditions, showing green dye reaching end of channel at ~4–5 h, and blue 20 nm particles not exceeding ~50% over entire 8 h experiment. Total timepoints = 16, total chamber length after removing data is 7.5 mm.
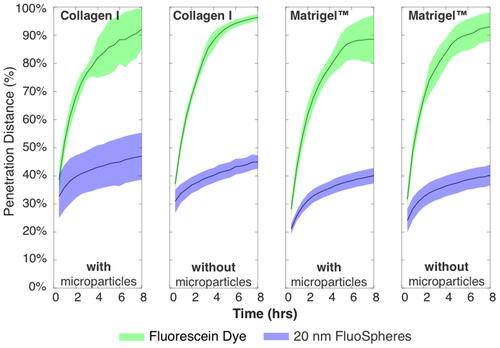
Figure 6 Results from automated analysis of fluorescent imaging data with a 10% threshold at t = 8 h, showing that green dye can be tracked to its ~100% penetration, and blue 20 nm particles can be tracked to ~40% penetration with the same threshold. The total chamber length after removing data is 7.5 mm.
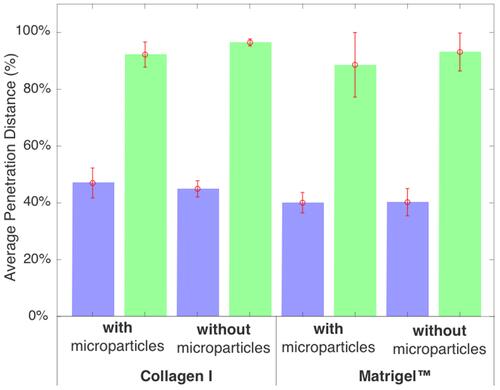
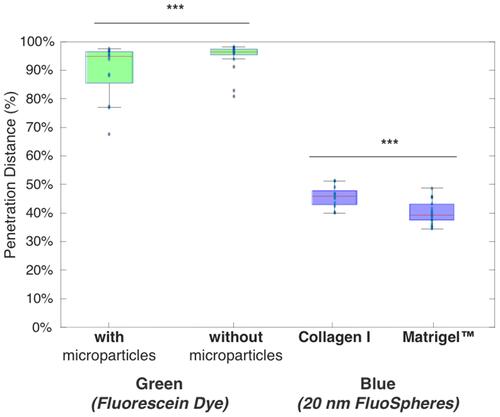
Figure 7 Two significant results found in overall analysis, showing green dye is affected by presence or absence of microparticles, and blue nanoparticles are affected by gel type. The total chamber length after removing data is 7.5mm. (***) denotes p<0.005.