Figures & data
Figure 1 Cytotoxic effect of CuNP exposure in ovarian granulosa cells.
Notes: (A) The viability of COV434 cells after 12 and 24 h of treatment with different concentrations (0, 50, 100, 150, and 200 μg/mL) of CuNPs. (B) COV434 cell apoptosis before and after CuNP treatment. In the flow chart, Q3 indicates early apoptosis and Q2 indicates late apoptosis. (C) MMP in COV434 cells before and after CuNP treatment. aIndicates no difference between groups; *p < 0.05, ***p < 0.001.
Abbreviations: CuNPs, copper nanoparticles; MMP, mitochondrial membrane potential.
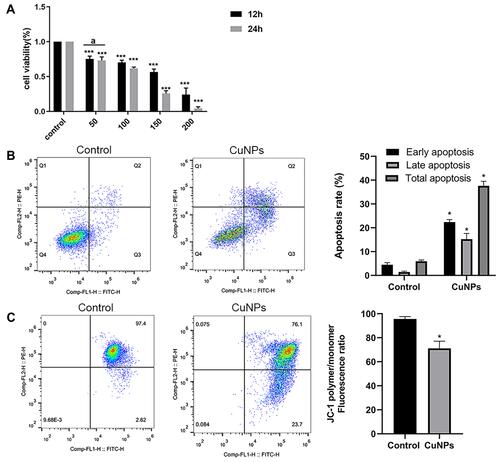
Figure 2 Effect of CuNP exposure on ROS (A), MDA (B), SOD (C), GSH (D), and CAT (E) in COV434 cells.
Notes: Compared to the control group: *p < 0.05, **p < 0.01, ***p < 0.001.
Abbreviations: ROS, reactive oxygen species; MDA, malonaldehyde; SOD, superoxide dismutase; GSH, glutathione peroxidase; CAT, catalase.
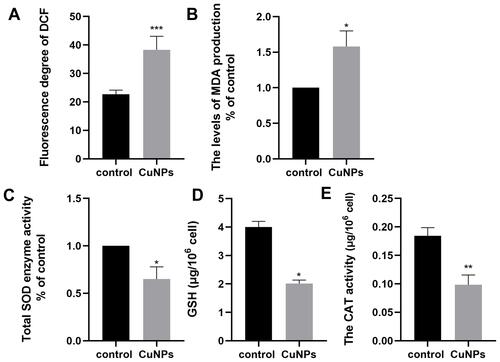
Figure 3 Levels of MAPK14, p-MAPK14, Nrf2, HO-1, and NQO1 proteins in COV434 cells exposed to CuNPs.
Notes: (A) Western blotting images of p-MAPK14 and MAPK14 proteins at different times of exposure to CuNPs. (B and C) Densitometric analysis of p-MAPK14 and MAPK14 protein bands. (D) Western blotting images of Nrf2, Keap1, HO-1, and NQO1 proteins. (E) Densitometric analysis of protein bands. *p < 0.05; a,bIndicate statistical significance, with the same letters indicating no difference between groups.
Abbreviations: MAPK14, mitogen-activated protein kinase 14; Nrf2, nuclear factor erythroid 2-related factor 2; HO-1, heme oxygenase 1; NQO1, NAD(P)H quinone dehydrogenase 1; CuNPs, copper nanoparticles.
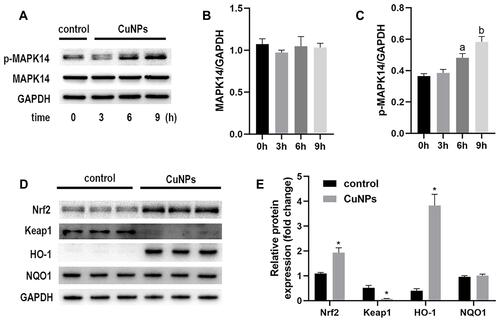
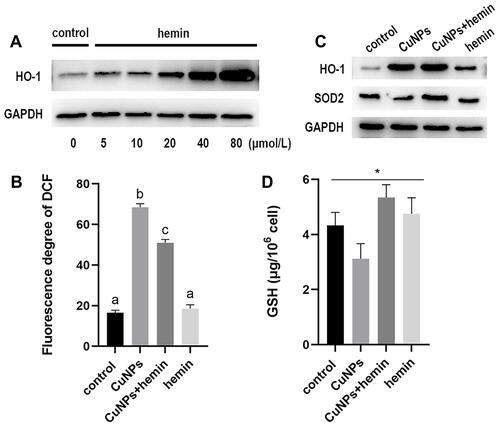
Figure 4 Effect of HO-1 induction in COV434 cells exposed to CuNPs.
Notes: (A) Western blotting images of HO-1 protein expression. COV434 cells were treated with different concentrations (μmol/L) of hemin for 48 h. (B) ROS levels in COV434 cells exposed to CuNPs before and after HO-1 overexpression. (C) Western blotting images of HO-1 and SOD2 proteins. (D) GSH levels in COV434 cells exposed to CuNPs before and after HO-1 overexpression. *p < 0.05; a,b,cIndicate statistical significance, with the same letters indicating no difference between groups.
Abbreviations: HO-1, heme oxygenase 1; CuNPs, copper nanoparticles; ROS, reactive oxygen species; SOD2, superoxide dismutase 2; GSH, glutathione peroxidase.